I was born within two months of LeBron James. That means, whenever he has a birthday, I get to hear how no one his age has done what he’s done in so short of time. Don’t get me wrong, he plays for my favorite basketball team, is amazing, and won a championship, so it’s not that big of a deal. But if I were someone who felt the need to compare himself to others my age, it would be intimidating. For example, when I was 18, I was a freshman in college struggling to afford Ramen. LeBron was NBA Rookie of the Year and had a $90 million endorsement deal with Nike. Things like that.

The Sodium Soaked Up My Sadness
Image Credit: frankieleon
But comparison can also be a powerful tool. When framed against your peers (instead of a superstar athlete who happens to share your age), it can show you how something is relatively performing. In enterprise IT, it’s easy to get caught up in absolute metrics. We all have targets of how many IOPS we need, or how much latency is too much. But comparative metrics are also important. It would be nice to know if with an identical network setup, someone is getting substantially better performance overall. If nothing else, this give you an idea of where to start looks when problems come up. Most network monitoring and analytics focus on raw numbers without a comparison context. Nyansa’s Voyance solution puts it front and center.
I got a look at Voyance during Networking Field Day last week. It’s is centered around getting a better understanding of user experience of the network. That’s a refreshingly different take on network monitoring. When they first laid it out, it actually reminded me (broadly) of wireless client-side monitoring. The implementation of how to do that monitoring is fundamentally different, but the intent is somewhat the same.
To get these, Nyansa uses crawlers which connect to a given switch and request data via SNMP. These crawlers are able to handle a decent load of traffic, up to 18 Gb per second. The crawlers do deep packet inspection on the traffic, and begin churning out the metrics. These stay on site, but users can set to have this routed to the cloud for Nyansa’s comparative analytics. This is all anonymized, and won’t tie up the WAN with too much extra traffic, Nyansa estimates each gigabit per second requires about 400-500 kilobits per second on the WAN. Nyansa then does dedupe once this hits the cloud. The company isn’t targeting data that needs HIPAA compliance as a major use case, and isn’t pursuing any certification for handling that kind of data. That being said, for organizations with those needs, Nyansa can setup entirely on-prem solutions as well.

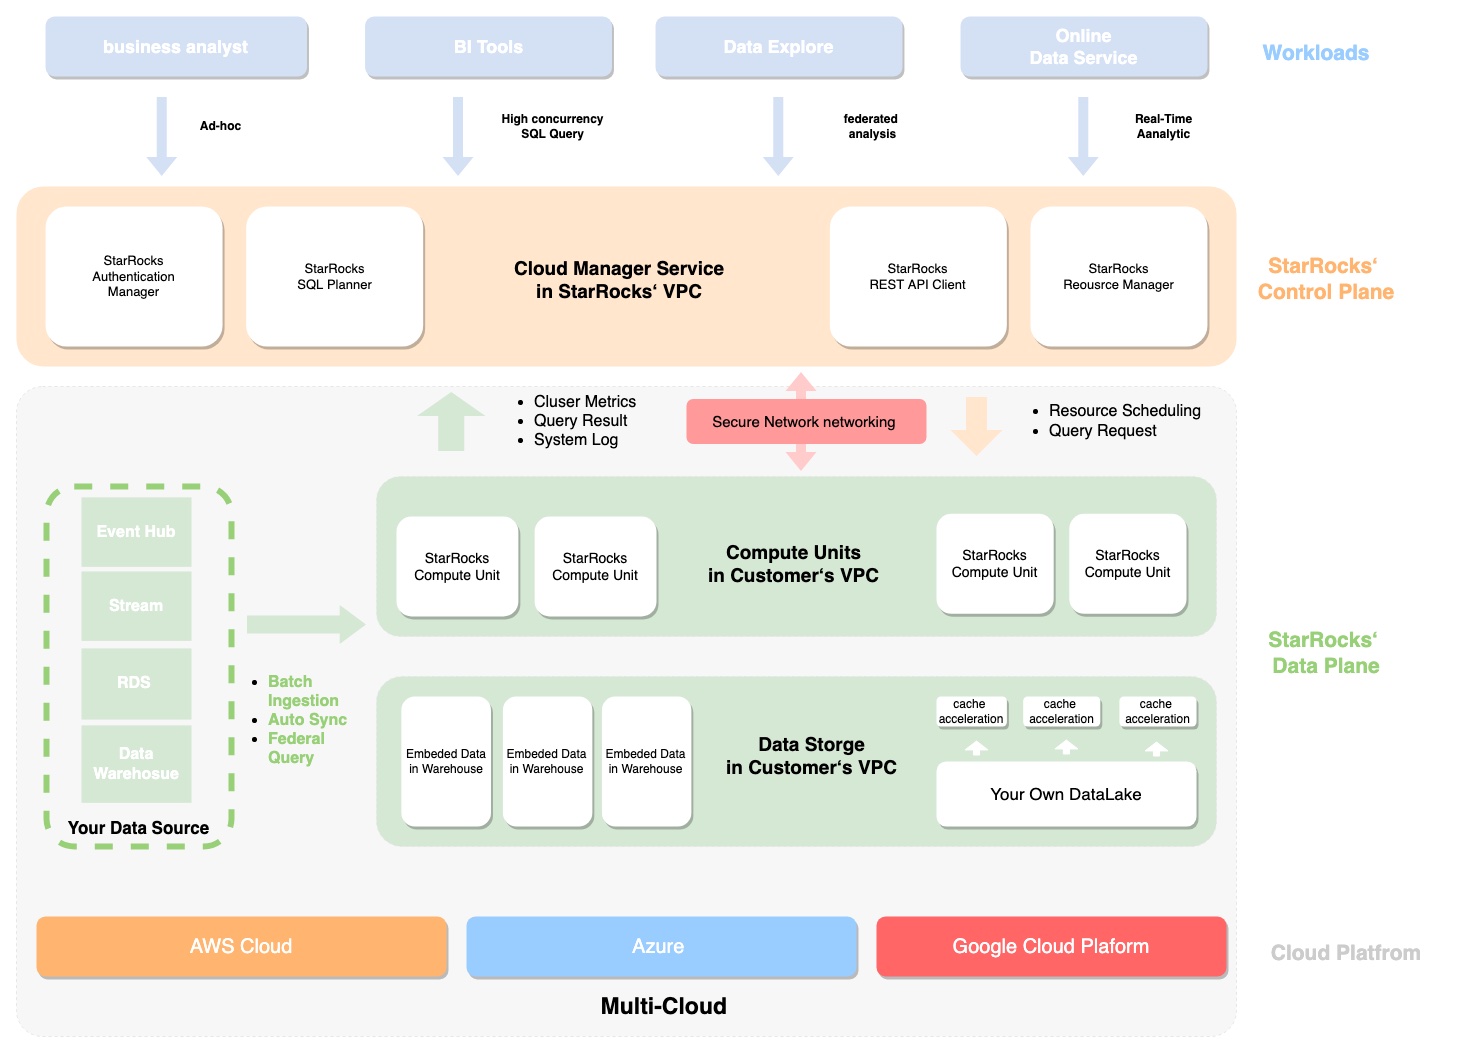
Voyance Comparison Tool
Once this anonymized data is sent to Nyansa, you can begin to compare your performance against other similar configuration. The system needs some times to baseline what your performance is, the company estimates about a week to get a good snapshot of overall performance. The only limits on this is the Nyansa user base. If you have a particularly unique network, there might not be a direct comparable. What I do like is that you get some network details about the other comparable, so even if it’s not directly comparable, it gives you some context to adjust your expectations. Of course, interpreting these comparisons are a matter of institutional priority. It’s nice to know that you don’t have the worst performance, but if you have SLAs that demand a certain performance, knowing that you’re doing average for your setup isn’t as useful as raw numbers.
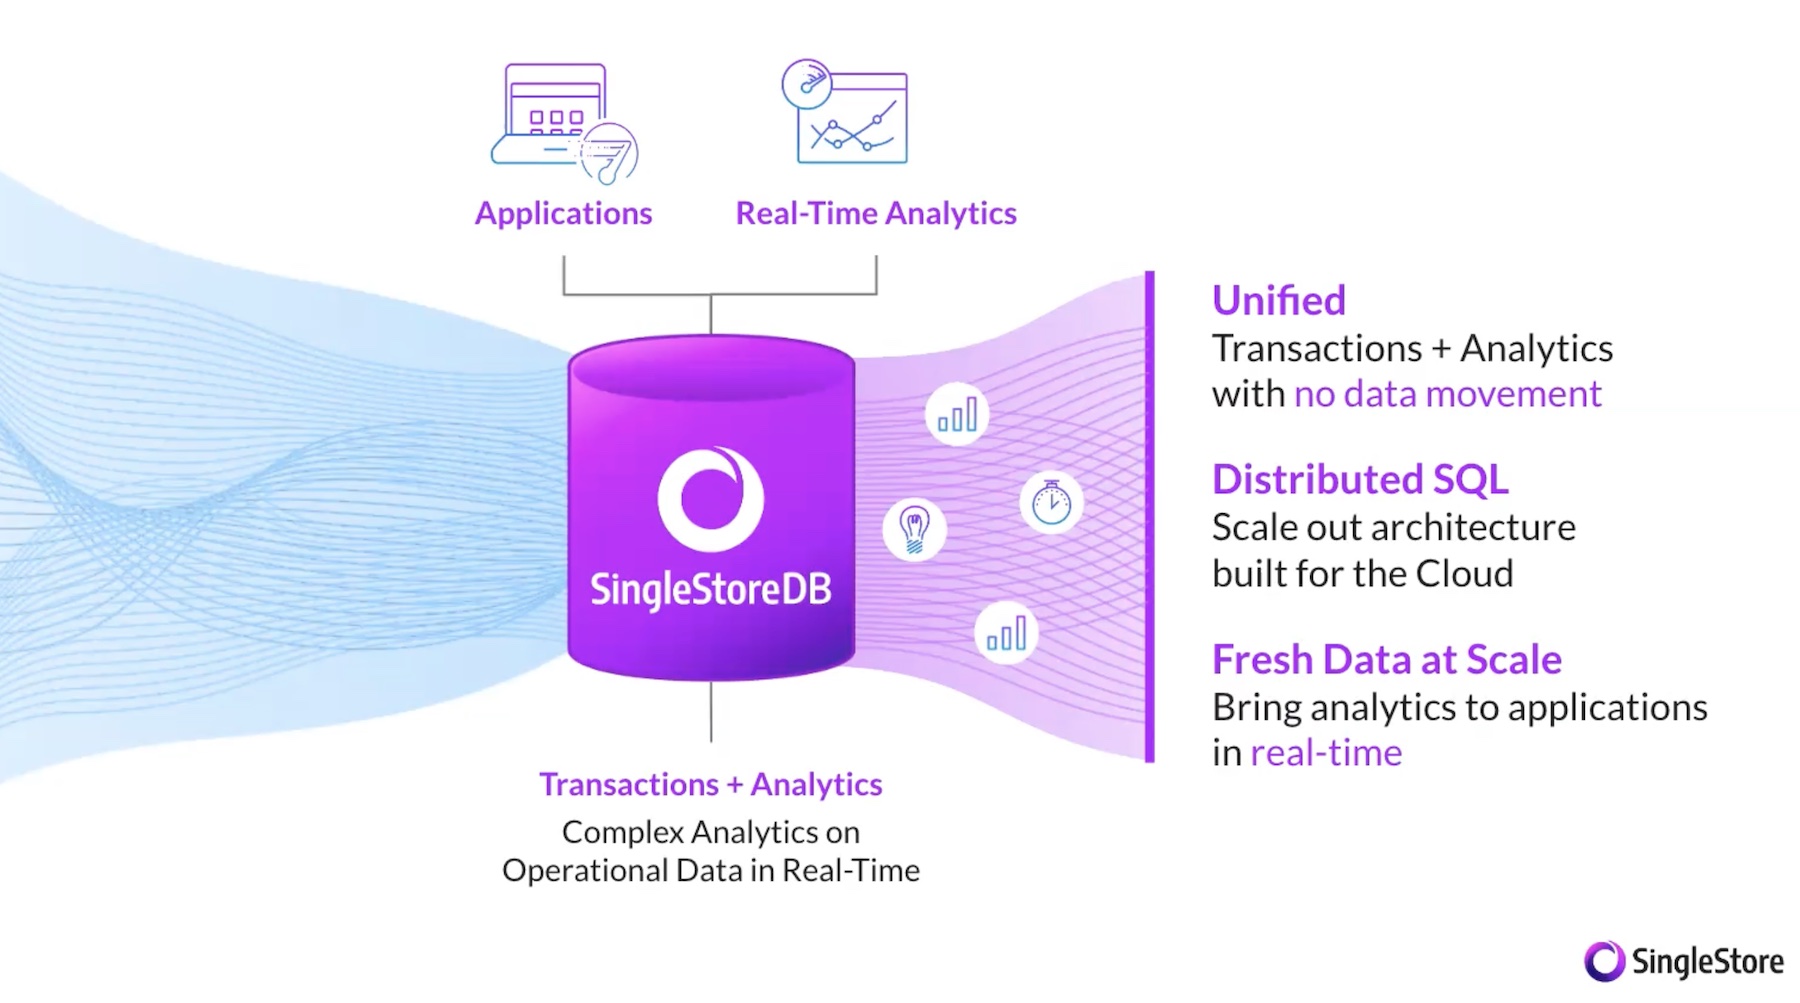
Of course, Nyansa doesn’t just provide comparative analytics. They’re capturing a ton of data, and this is all outlined in their dashboard for review. You get a lot of typic performance metrics here with a couple of notable features. I really like that it puts application usage on a network front and center in the dashboard, allowing you to easily see what’s overall taking up traffic, but also allowing you to drill down to individual point on the network.

Voyance Dashboard
The other thing I really liked is the ability to specify the types of client’s connecting to the network when looking at performance. This allows you to see if there are specific problems on mobile, or more general. This is again put in a primary spot of the dashboard for easy access, and it’s good to see a company immediately seeing that as a need for network management.
Nyansa isn’t in the business of remediation with Voyance, but it is doing some interesting things to find problems. Problematic clients that are performing poorly are sorted into their own section in the dashboard. This is then analyzed, with the potential causes listed in terms of their probably given its specific conditions. Again, this isn’t going to eliminate troubleshooting, but it’s definitely a great sorting tool, and should save a lot of time ignoring issues that’s can’t have come up.
Voyance offers something important in the networking monitoring world: context. The entire solution is geared to remind you of it. In their comparison tool, you get to see how similar real world networks are performing. In their analysis tools, you get to see how real world users are experiencing the network. It’s a particularly grounded approach that I think will serve Nyansa well.
[…] Nyansa’s Comparative Analytics […]