Riverbed has a comprehensive suite of network management tools that provide good network management visibility. The suite provides the functions you’d want to have in a network monitoring suite, allowing you to identify problems and determine if they are caused by the network, applications, or client endpoints. I recently had the opportunity to test drive these products in demo environments to evaluate their use.
The Suite
The Riverbed network monitoring suite includes a number of products. My review was focused on four:
- Portal – A single user interface that aggregates multiple data sources within Riverbed’s product suite, including tools that were not reviewed
- NetIM – network infrastructure monitoring
- NetProfiler – flow data analyzer
- AppResponse – packet and application performance analyzer
I was able to test-drive these products in demo environments to evaluate their use.
Portal
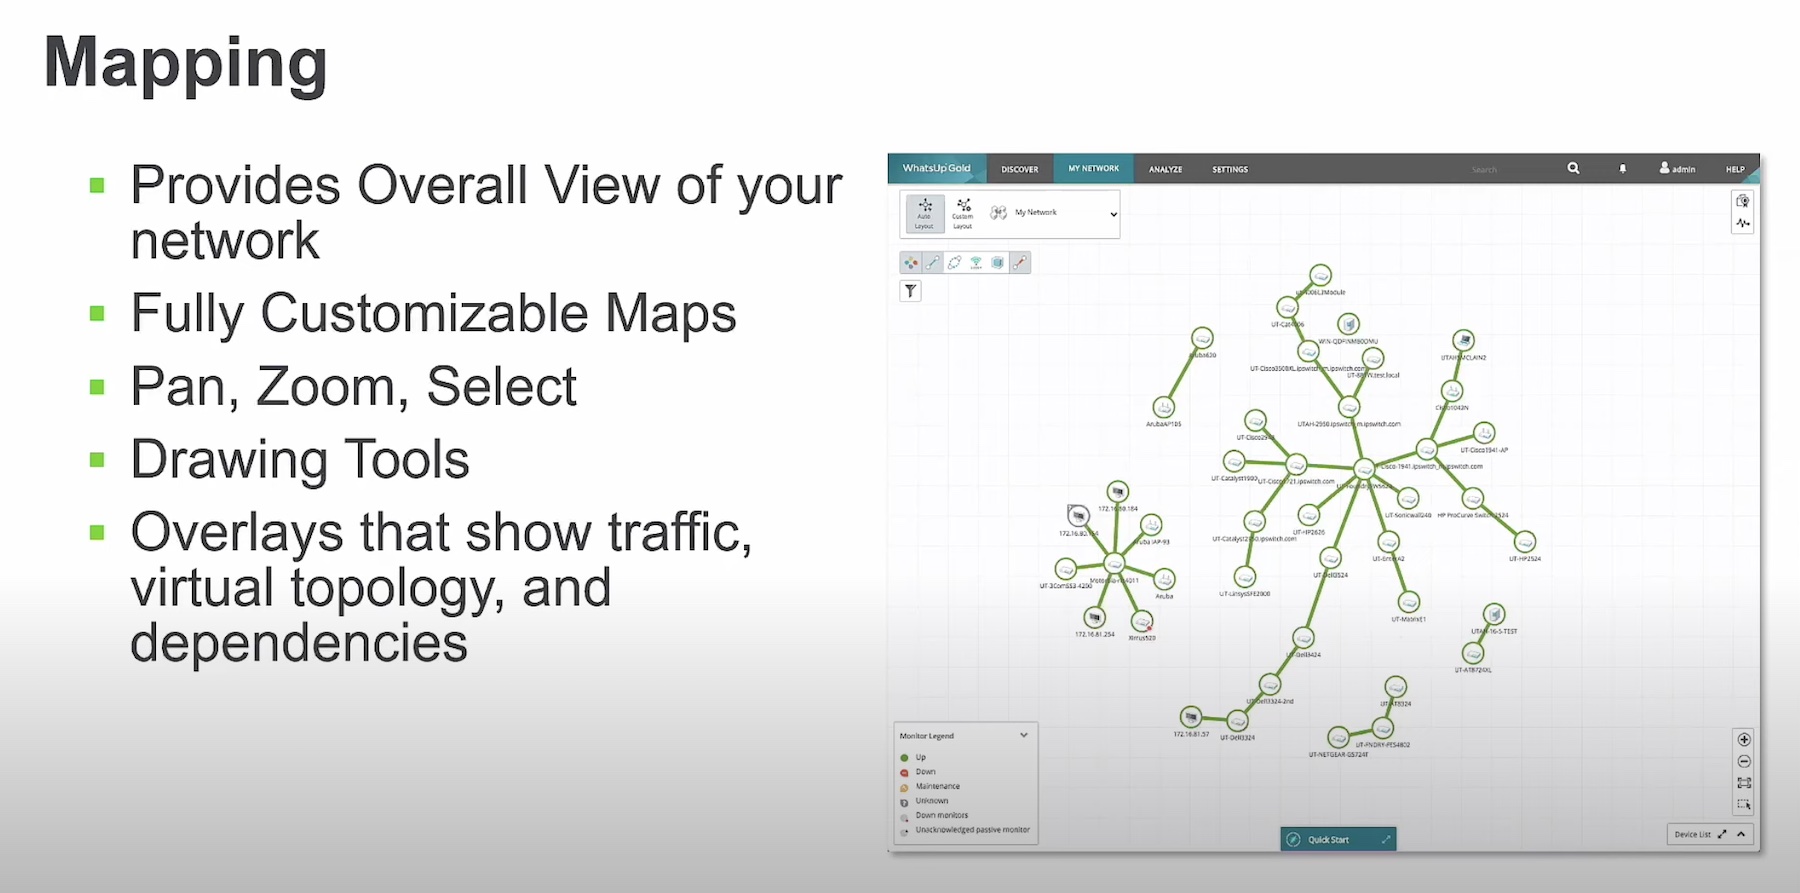
Portal aggregates views of all the Riverbed data sources into a single view. You would use it as a dashboard into the entire system. It uses links between the specific data sources to make the suite function like a single product.
In the demo, an interface in NetIM is identified as having high utilization (>90%) over an hour. The obvious question is, What applications are running over the link? Portal provides a quick drill-down to NetProfiler’s flow data for that interface. A quick check shows that Microsoft SCCM (software updates) was consuming a significant amount of link bandwidth. The conclusion was to schedule SCCM to run during off-hours when it wouldn’t impact regular business applications. My take on the example is that since there were no drops on the interface, it could continue to run without impacting any applications. The software updates may have been occurring to devices that were unavailable after hours. Configuring QoS on the link to de-prioritize SCCM would be another valid approach.
NetIM
NetIM provides a standard set of network monitoring functions—device availability, device performance statistics, interface statistics (utilization, errors, drops, state changes), device configuration backup, etc.
The architecture uses multiple physical or virtual machine instances running Docker instances to separate the data collection, database storage, and user interface components from each other. Riverbed recommends installing NetIM in the data center or cloud so that it is close to the resources it is monitoring.
This increases flexibility and allows each component to be scaled out as necessary to provide the desired performance. Need more polling and database performance because of an acquisition? Just add a few more docker instances for polling engines and storage engines.
The Cassandra big-data database is used to allow easy scaling of the storage system. A single system can collect interface performance data from up to 600,000 interfaces, which should cover most networks. Raw data is stored for 31 days, after which it is rolled up through averaging.
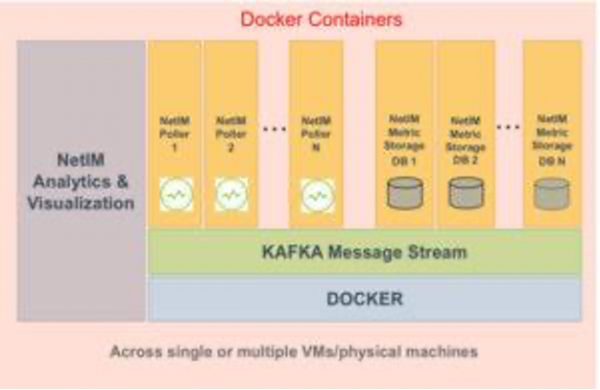
NetIM’s Flexible Architecture
NetIM can collect performance data at multiple rates, from 30 seconds to 60 minutes, with a default value of 5 minutes. As expected, custom MIBs can be loaded, allowing for the support of uncommon devices.
I like NetIM’s use of the 95th and 98th percentile interface performance figures since it is easy to get misled on periods of high utilization by only examining minimum, maximum, and mean values. Up to three values can be saved and selected in the Rollup Wizard. The data retention defaults are reasonable and can be customized.
I found one area where I would like to see an improvement: interface error and discard thresholding and reporting. The alert thresholds can only be set to integer values of percentage. One percent errors on a gigabit interface will cause a significant throughput decrease for TCP sessions. The report display shows two decimal digits of precision (e.g., 0.01%). This may seem small, but research on TCP’s performance shows that a small fraction of errors and discards cause significant performance degradation. (See articles on the Mathis Equation.)
NetProfiler
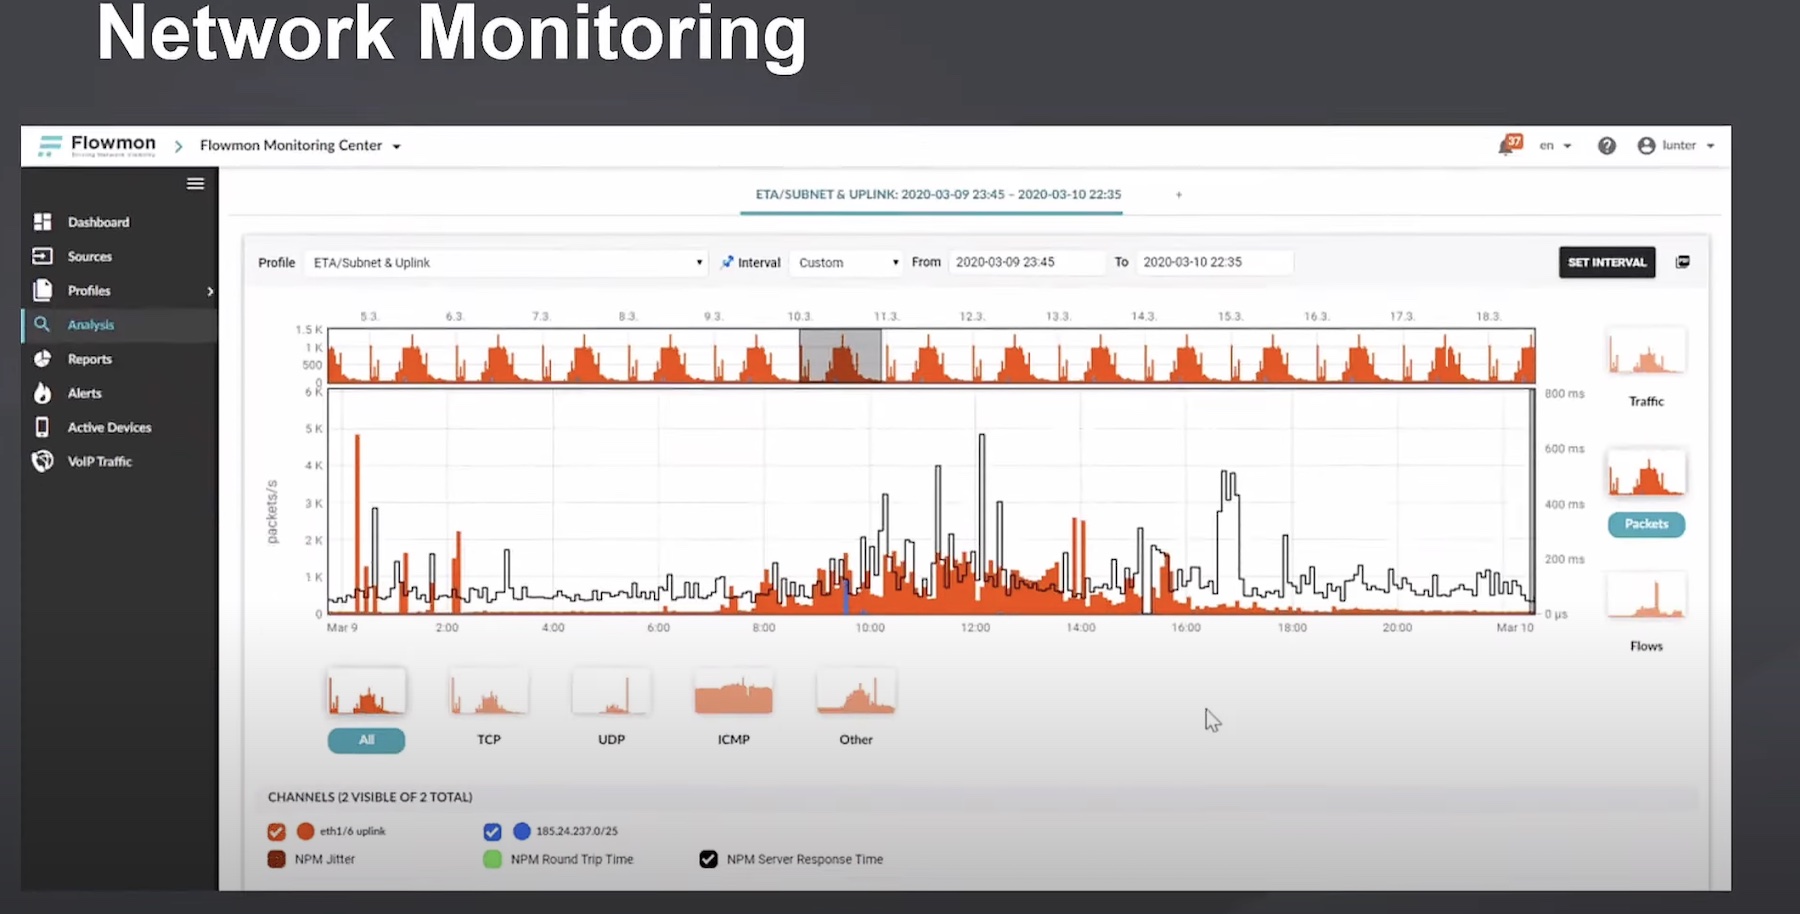
NetProfiler is a flow data collector and analysis engine. It is extremely useful for identifying the applications on a link with high utilization or experiencing discards due to congestion.
Understanding the traffic mix on an interface is critical for good capacity planning. High-resolution flow data is required to understand the magnitude of the peaks and plan accordingly. Note that TCP-based applications will want to consume as much bandwidth as possible, so plan link capacity carefully. A short-duration traffic peak that occurs twice a day may not be cause for a link upgrade unless the need for more bandwidth is predicted.
NetProfiler is also valuable for identifying whether the applications on the link are business-related. At NetCraftsmen, we often find some entertainment traffic volume (i.e., Facebook, streaming music, etc.), which can either be eliminated by filters or constrained with QoS strategies. We find that limiting entertainment applications through QoS keeps employees happier than denying all such traffic.
AppResponse
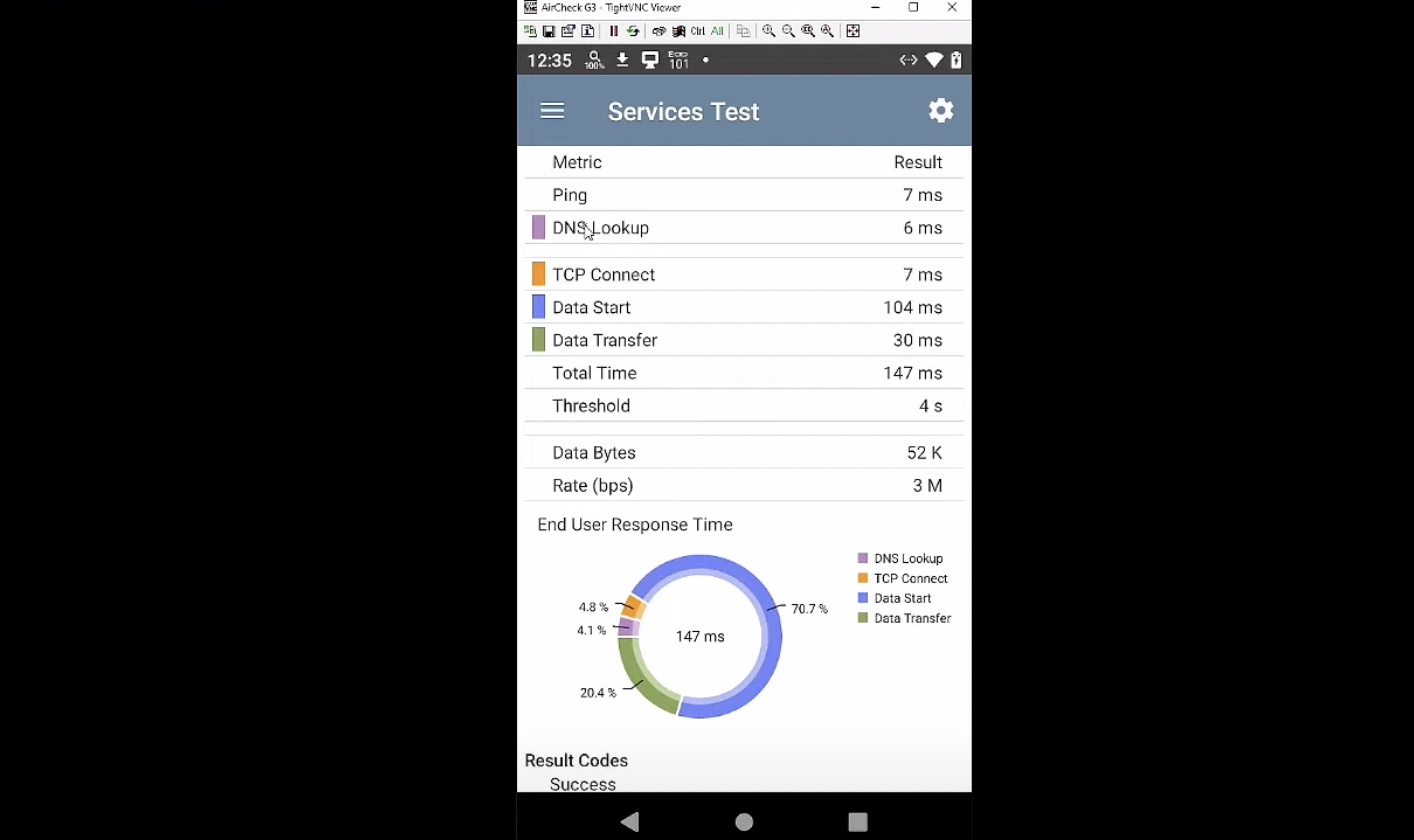
AppResponse is a very smart packet capture and analysis system. It allows you to identify whether an application problem is due to something on the client endpoint (perhaps a JavaScript problem), a network problem (latency or packet loss), or a server problem (slow server response to a transaction). It uses packet captures, frequently obtained through packet brokers, to gain detailed visibility into application performance. It can see packet retransmissions that indicate a network problem or a server that is slow in responding to a client request. This visibility makes complex application performance problems transparent and significantly reduces troubleshooting time.
The slow server example is particularly valuable. In one case, an under-provisioned server VM caused the slow performance of a critical backup. Of course, the network was somehow at fault, but there was no evidence to substantiate it. Examining the packet capture details using AppResponse determined that the network was not at fault and that the server was taking 200ms to acknowledge the stream of backup packets. The backup server was found to be running at nearly 100% CPU. Re-provisioning, the VM server with more CPU, solved the problem.
Summary
The Riverbed set of network management applications provides a comprehensive view of enterprise networks. Its comprehensive visibility is necessary to find nagging and difficult-to-diagnose problems like AppResponse’s ability to identify slow SaaS applications, NetProfiler’s flow analysis to detect applications on a link with high utilization, or NetIM’s reporting of performance-killing interface errors and drops. Riverbed provides essential visibility into applications and their use of the network.
Reference: NetIM 2.0 Advances Horizontal Scale and Performance