Today’s networks support a wide swath of mission-critical workloads. That significantly raises the baseline requirement for network availability because we all have seen how even the shortest downtimes can turn things pretty chaotic and cost big bucks. But owing to the overwhelmingly complex digital landscape, the five-nines or 99.999% uptime is extraordinarily difficult to pull off. Nevertheless, it’s a worthwhile pursuit.
At the recent Networking Field Day event at Silicon Valley, Kentik presented it’s observability capabilities with which it scopes the environment 24/7 for anomalies and deviations and minimizes unplanned downtime.
Modern Networks Are Like Riddles
The network today is complex, period. You may have heard this ad infinitum and that’s because it is true to the last word. Trends like hybrid multi-cloud is making the network topology look increasingly random and no fun to manage. And the fact that all the components in the network are constantly communicating between themselves leads to greater entropy.
Kentik boils down the problems with the enterprise network into three things- complex, critical and customers. The current level of complexity has made the work of network engineers daunting. Added to the pressure is customers’ expectations which are a constant reminder of the fact that even the smallest failure is a huge inconvenience to them.
Kentik Makes Networking Less Mind-Numbing
Thus far, enterprises have taken reactive measures to unplanned outages and failures, but in a time when network uptime is mission-critical, it is vital that the network returns to normal function at a minimum time, and the most realistic way of doing this or cutting downtime is through constant vigilance.
Kentik unlocks total observability by bringing to the enterprises the ability to observe all networks ranging from datacenters to public cloud, the edge, SD-WAN, WAN, containers, the internet and more. The Kentik Platform provides contextual visibility by collecting a wide range of telemetry such as traffic, routing and performance. Data with context helps the engineering teams answer questions and resolve issues in a flash.
But data without insights is just noise. Kentik correlates the datapoints filtering them down to insights with results. One of Kentik’s core missions is to provide data with which engineers are able to get to the root cause quickly. From its multitude of telemetry covering every metric and dimension, and with blazing fast query speed, network engineers can drill deep into an alert and accelerate RCA.
Full-Stack Observability with Kentik
At the Networking Field Day event, Kentik’s VP of Global Solutions Engineering, Justin Ryburn talked about observability. In the presentation, he went over the complexities surrounding managing a complex enterprise network and detailed how Kentik makes it easy. He finished the presentation with a demo making things more visual for the audience.
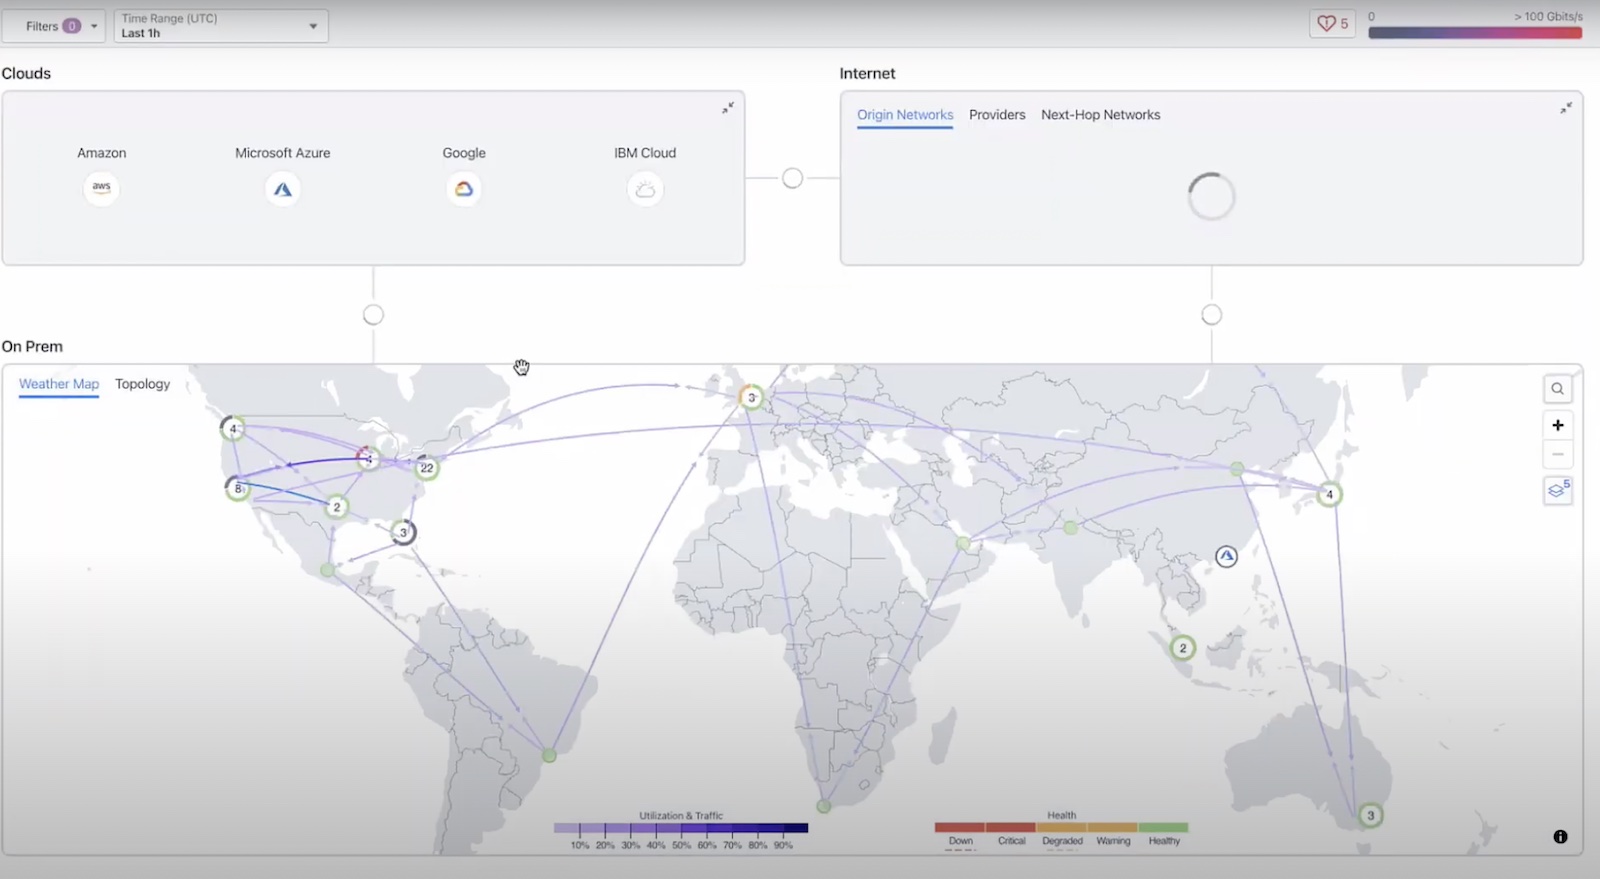
Ryburn explained, “Once you start migrating workloads up into the public cloud, you need to be able to understand that network the same way you understand your datacenter network, your branch network, what’s talking to what, and those are very different networks that are in the public cloud than what you had on-prem.” Kentik makes comprehending these new, vastly different networks easily with powerful visualization. On Kentik, not only can you view your entire cloud environment, but also zoom into individual components for close scrutiny.
Kentik gathers flow data, health metric, VPC connectivity and performance data in the multi-cloud to help engineers keep a tab on the overall connectivity and performance. So that engineers don’t have to go finding a needle in a haystack when a problem arises, it extrapolates analytics from the data helping cross out probabilities and get to the root cause faster.

Kentik provides detailed path visualization with a logical topology map that shows the traffic path hop by hop, revealing trouble spots that need fixing. It keeps the teams alerted on any or all path changes that lead to failures in the environment.
Although Kentik does not brand itself as a security product, it does serve some security use cases in the cloud. Kentik lets enterprises forensically examine data breaches. With the data available on the platform and with the help of Kentik Data Explorer that lets users query specific information, SecOps can reverse-engineer an attack by looking into specific parameters when examining the blast radius after an event. The available data is also helpful in detecting and shutting down bad actors.
Users can also set proactive notifications for things like probes and attacks and that way spot a potential attacker in the network and block a breach before it happens. With alerts and insights, operators can also detect botnets and shut them down in real-time.
The BGP Monitor Test in Kentik Synthetics enables enterprises to discover BGP hijacks and leaks that lead to reachability and performance issues. Alerts are sent out instantly when a hijack or path change, a route leak, a BGP event of suspicious origin or an invalid RPKI status is caught.
Wrapping up
In the network, even the smallest frictions can have big consequence. Kentik makes sure that your enterprise network does not suffer the domino effect by watching the networks and their constituents all the time. In doing that, it not only helps enterprises gain full visibility of a heterogenous and distributed environment through a single pane of glass, but also helps see the red flags ahead of time. By bringing together actionable data, it helps engineers easily navigate through information and find answers fast, thus reducing MTTR. Ultimately, by improving network uptime, Kentik supports interruption-free operation of enterprise applications.
To know more about Kentik’s observability powers, check out Kentik’s other presentations from the recent Networking Field Day event.

