
Military strategist, John Boyd, back in the mid-1900’s, developed a decision-making model that’s passed down as one of the most enduring approaches of combat operation. It is famously known as the OODA loop.
OODA stands for observe, orient, decide and act. The model explains how a quick retaliation in the battlefield can gain an army significant advantage over brute power.
The OODA loop has not only been a principal concept in military defense strategies. In modern-day cybersecurity, it is the gospel of security analysts.
A Tool to Enforce and Boost the OODA Loop
Cisco XDR is built to hyper-enable this loop in cybersecurity. Distinguished engineer, Matt Robertson, describes it as “an efficiency tool” for the Security Operations Center (SOC).
XDR brings to offer a very specific set of capabilities,. If properly implemented, they can help SOCs deliver a swift response to unfolding attack chains and get ahead of the opponent.
XDR follows three logical steps – investigate, prioritize and act. In a nutshell, Robertson explained them the TFD audience at Tech Field Day Extra at Cisco Live US 2024.
“Cisco XDR is a collector of data from multiple security tools. We apply analytics to the data to arrive at detection of maliciousness, and then provide response through automated actions.”
In short, operators can go straight to action and remediation with speed and efficacy with the insights it offers.
Cisco XDR performs two types of detections – native and extended. Detections that are made from downstream sources – like cloud logs, NVM and NetFlow- that do not contain native verdicts, are called native detections. Data is run through behavioral models that list down the observations, and subsequently alerts are built around them.
These are high-fidelity, low-noise alerts. Only observations that strictly meet the threshold of active alerts are passed as alerts. “Not everything that is malicious passes this threshold,” he says.
For extended detection, data is taken in from integrated products and investigated through correlation. This data already has verdict natively built into it. Cisco XDR enriches it by layering it with additional data.
A Long and Complex Analytics Pipeline
The data analytics pipeline where incidents are created and fine-tuned in XDR is highly nuanced. “It goes through a long, complex analytics pipeline.”
Robertson explains what is an incident in XDR terminology. “An incident is a data object that is made up of data from multiple security tools or integrated toolsets. As data comes in, we do analytics and correlation, and create a logical incident bundle which is the object upon which an analyst is going to interact.”
To help understand the process of incident generation, lets divide the pipeline into two segments – data acquisition and data analytics.
Data is the meat and potato of this pipeline. Multiple sources across various domains are scraped to collect this data. Some examples of data collected are EDR (end-point detection and response) technologies, network telemetry, data from hosted infrastructures like AWS, GCP and Azure, identity service engines, emails, etc.
“Depending on the source, some are API, and some are streaming data,” Robertson notes.
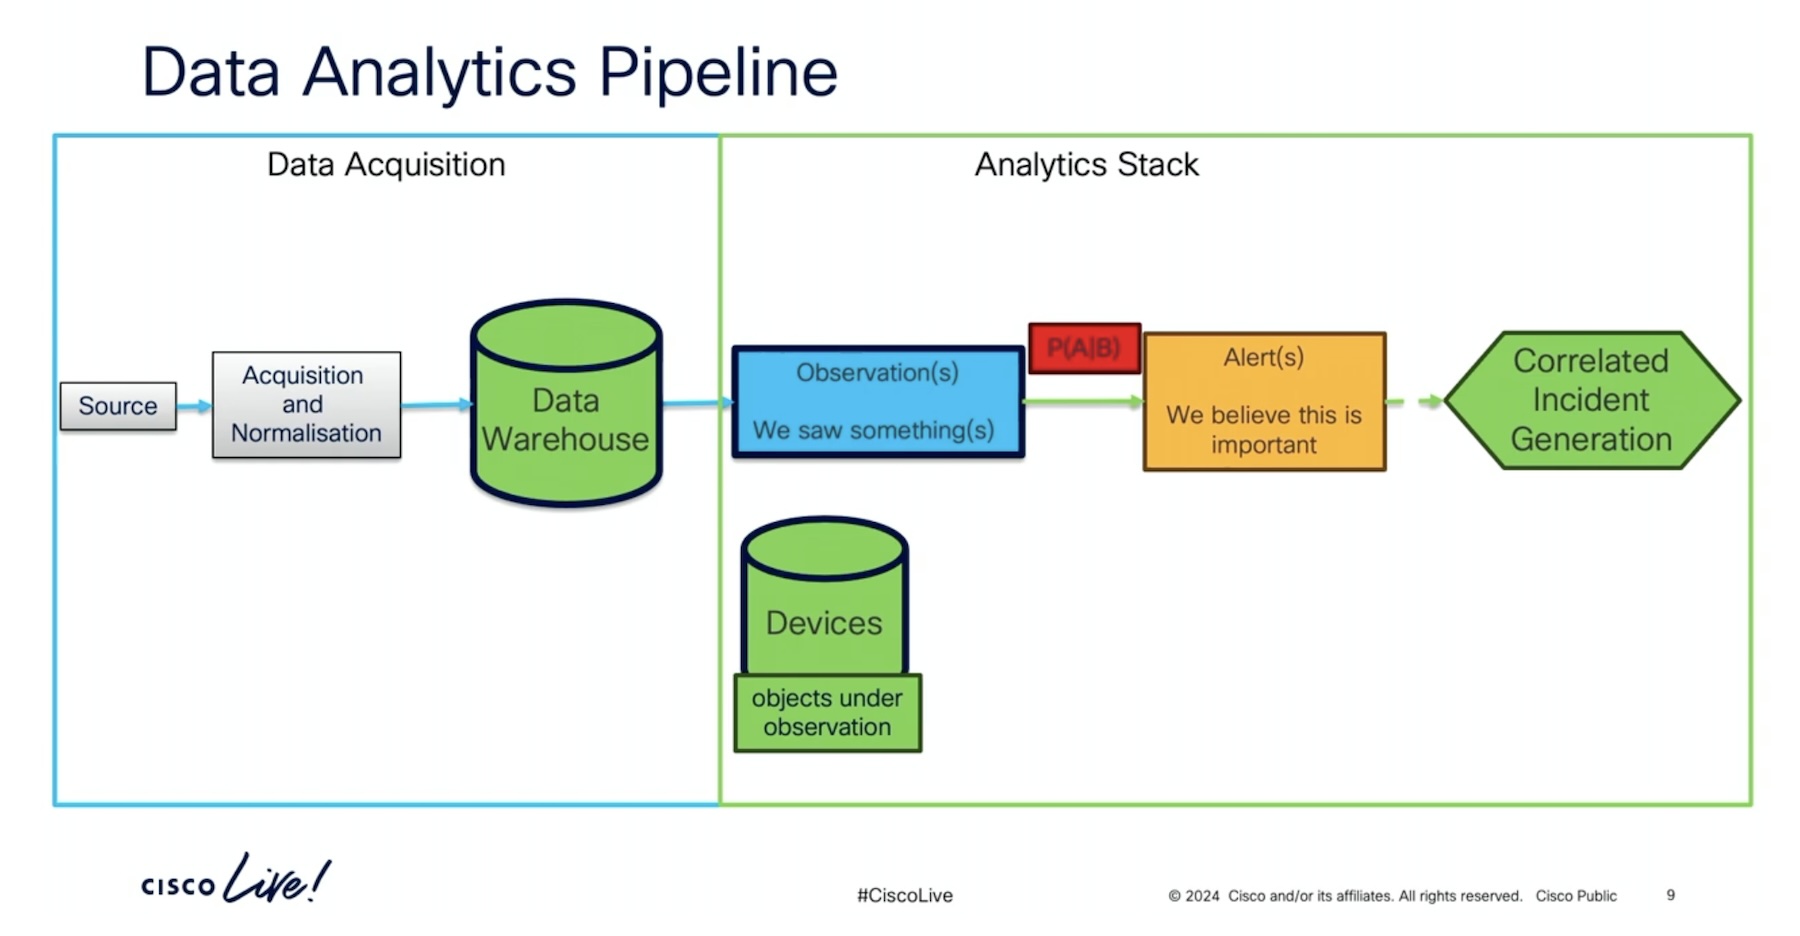
This corpus is normalized and sent to the data warehouse where analytics engines thresh insights from the raw datasets.
The analytics segment reveals another complex layout of phases and processes. It primarily includes observation, alerting, prioritization and incident generation.
Algorithms skim data for indicators of compromise. The observations are then profiled based on severity. A probability-driven model does this by sifting through the datapoints and deciding which of the findings qualify as alerts.
Inside Cisco XDR’s Correlated Incident Generation
Perhaps the most important and intricate of the processes in the pipeline is correlated incident generation.
“It’s about taking multiple alerts and reconstructing the attack chain,” explains Robertson.
The process begins by aggregating a bunch of independent alerts from across domains and correlating them to trace a logical attack path. If the findings correlate, a GenAI SOC assistant takes over to investigate the datapoints. It puts together a brief summary of the attack, and incidents are surfaced on the UI for operators to inspect.
The SOC Assistant is a newly-introduced feature that also guides the investigation by producing incident-specific workflows with next best steps, and lets operators launch war rooms on integrated messaging platforms.
“An incident is never complete until you mark it as complete,” Robertson reminds. “It can continue to have more data put into it as detection analytics identify more alerts.”
All incidents go through a scoring process where scoring algorithms determine their priority levels based on risks and asset value. Depending on whether an incident is gaining additional data or not, the algorithms prioritize or deprioritize them.
In the final stage, insights are enriched with additional information from integrated products. “That data is then decorated on top of the logical incident bundle.”
Check out the Cisco XDR presentation from Tech Field Day Extra at Cisco Live US 2024 to catch the demo at TechFieldDay.com.