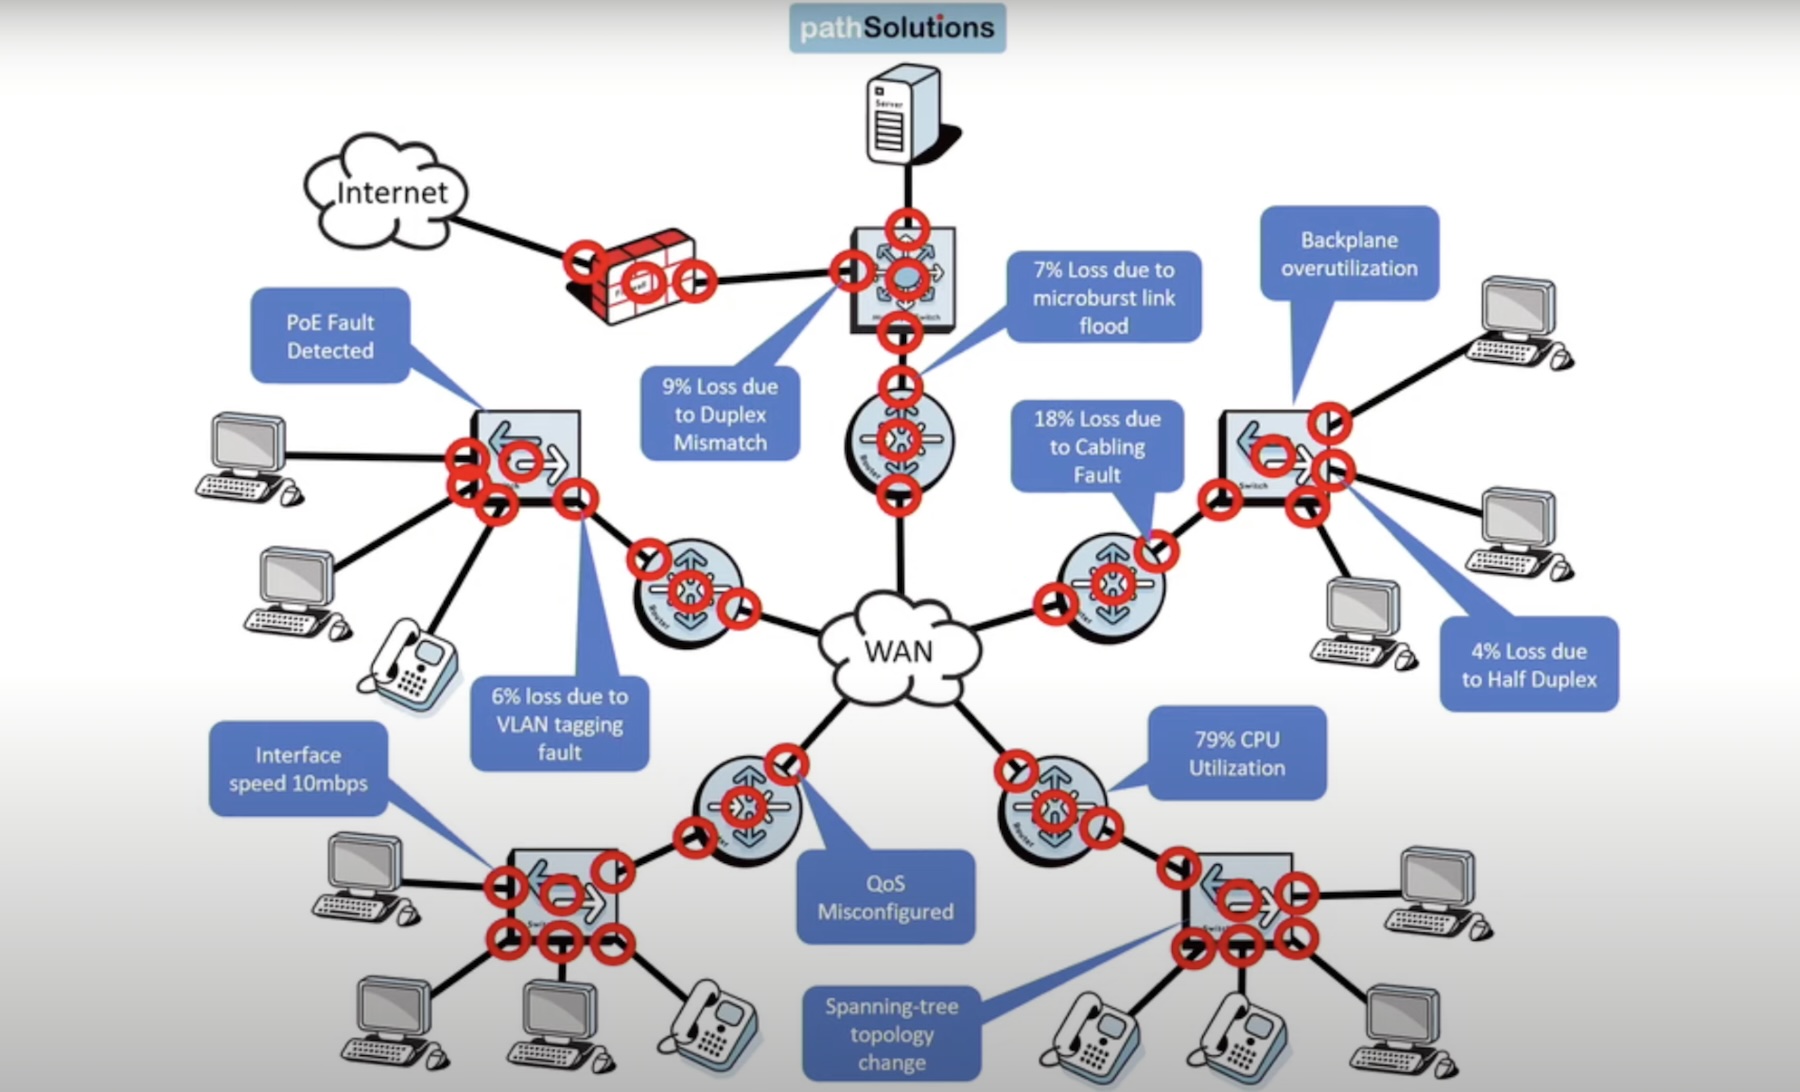
Imagine spotting a teeny-tiny needle in a stack of hay. The odds are one in a million.
That’s how most network engineers describe the experience of finding the root causes of network issues. Root-cause analysis or RCA, the process of spotting the invisible factors behind a network incident, is long and winding – and inescapably manual.
Shockingly, monitoring tools designed to make the job easy are one of the key reasons for this. A highly complex setup process involving manual configuration of tools to the devices makes the job inherently tricky. It is easy to miss out some things occasionally, especially when new appliances are being added every day.
“Eventually you will say, I can’t spend another six weeks full-time, configuring and building it out any further. This is as far as you get,” says Tim Titus, CTO and founder of PathSolutions, a company that specializes in automating network monitoring and troubleshooting.
Operators “just want something that tells them what’s broken in the network,” he stresses.
About 17 years back, this led Titus, then network engineer, to quit his job and embark on a startup venture based out of his garage. Thus was born PathSolutions.
Accelerating the Journey from Discovery to Mean Time to Innocence
PathSolutions TotalView, a continuous monitoring software solution, aims to give network operators a break from manual RCA and troubleshooting. In a lot of ways, it shortens and simplifies the journey of discovery and remediation as we know it.
The solution deploys on a single machine, typically a VM in the datacenter or the headquarters, told Titus while presenting TotalView at the Networking Field Day event in Silicon Valley last month.
Using SNMP, it pings every device in the network – switch, router, gateway, firewall and interface –building the inventory. This gives it the broad, enhanced visibility essential for network monitoring.
“We go far broader than any other solution,” he highlights.
But more depth and granularity are required to perform troubleshooting, and for that, TotalView picks up individual data from touchpoints all over the network.
“Network equipment have an amazing amount of intelligence stocked up inside. We go deep and automatically pick up all the performance, configuration, 19 different error counters of information, QoS, CDP/LLDP, PoE, and all that rich information,” irrespective of the model or the make of the equipment.
The data is then sent into a heuristics engine that processes it using logic. The output is a detailed report of diagnostics of all the errors happening in the infrastructure.

Findings and recommendations are published in plain English to keep the information digestible for all personas, he says.
One clear benefit of this depth and breadth of visibility is timely resolution of failures. “You’re going to be able to do proactive troubleshooting – maybe for the first time in your career – and say, I can solve the problems before the users complain,” he says.
Titus claims that TotalView reports back every incident in the network on Day 1 of deployment. “By the end of the day, we’re going to tell you everything your network equipment knows is broken,” he underlines. This can reduce the lengthy, tangled process of tracing root causes down to hours.
TotalView also weighs in on the troubleshooting work. The solution generates “network prescriptions” for all errors detected, allowing more trouble tickets to be resolved and closed at the tier 1 help desk. The bulk of issues settled lower in the organizations allows for faster and more cost-effective troubleshooting.
“They can solve the cabling faults, the duplex mismatches, the PoE faults,” with no need to escalate, leaving only the most difficult tickets for the senior-level staff.
Additionally, to keep the network healthy and the number of incidents minimum by default, PathSolutions offers a bundle of essential features out of the box. These include diagramming, path mapping, port mapping, server monitoring, event correlation, cloud service monitoring, full inventory, IP address management (IPAM), BGP monitoring, configuration management and automation, all aimed at keeping the network running with minimum intervention.
Optional Add-On Modules
Also added in the solution is a set of optional modules curated for specific personas and use cases. For example, the TotalView Telecom Ops Module is aimed at telecom personnel. It specifically includes telecom operations features such as VoIP visibility, path mapping, call simulator, SIP-Trunk monitoring and WAN health, all of which offer deep visibility into the VoIP infrastructure, and provide ready analytics for call quality issues.
Similarly, the SecOps Module, designed for the SecOps team, offers certificate monitoring, OS vulnerability detection, geography risk management, exposure reporting and IoT security, services that are critical to ensure security of the network.
Other modules available on the platform are NetOps and remote user troubleshooting.
Check out PathSolutions’ presentations from the Networking Field Day event to get a holistic idea of TotalView’s capabilities.

