The network brings the world in a computer. With everything at the tip of the finger, one of the challenges businesses face is edge to edge visibility.
The network is bursting at the seams with countless devices and solutions deployed on its fabric. With its perimeter constantly shifting and expanding, it is becoming increasingly important to maintain a clear sight of everything to keep the network and its assets working as they should.
At the recent Networking Field Day event, one of the companies that dug deep into observability was Kentik. A startup with a network observability pedigree, Kentik is determined to unlock true observability of the increasingly complex, hybrid network of today.
Justin Ryburn, Vice President, Global Solutions Engineering, gave a briefing of the Kentik Network Observability Platform explaining its capabilities and inner workings.
For Kentik, observability is not just another new buzzword that is having its moment. Kentik defines observability as the ability to “answer any question about any network”. According to them, two key things make for true observability – a centralized repository of network data, and data enrichment.
Challenges of Being in the Know
Networks were a lot more intelligible when decades ago, companies used to have their own datacenters and colocations, and the edge of the network used to be a branch office. A small team of network engineers would build, configure, and maintain everything. With the exception of the Internet and some carrier circuits that a company may be leasing at the time, businesses had control over all of their network.
But things rapidly changed as cloud, and edge entered the picture. Visibility went from obstructed to obscure, and suddenly the networking team is buried under a landslide of minutiae and metrics.
The shifting dynamics and realities of hybrid network make it close to impossible for teams to watch over every digital asset and interaction. The whole network operation takes a hit because of this.
The Kentik Network Observability Platform
Kentik Network Observability platform offers a way for network teams to see deep into the heart of the network, and have information at their fingertips. Built on the needs of organizations on hybrid multi-cloud, Kentik watches all networks core to edge – the cloud, WAN, edge, the Internet and containers.
“We may either be delivering applications through a CDN, or have users on the enterprise network that are consuming applications through a CDN. So connectivity to the internet and those CDNs is critical for good user experience,” said Mr. Ryburn.
“We’re not a point solution that just looks at the datacenter or the SD-WAN, or a particular public cloud provider. Our mission is to be able to provide a platform that can look across all the various different networks that network engineers in the modern enterprise are tasked with looking after,” he added.
The highlight of the solution is data collection at full fidelity. The platform’s ability to measure the internal state of the network lies in its ability to collect all types of telemetry.
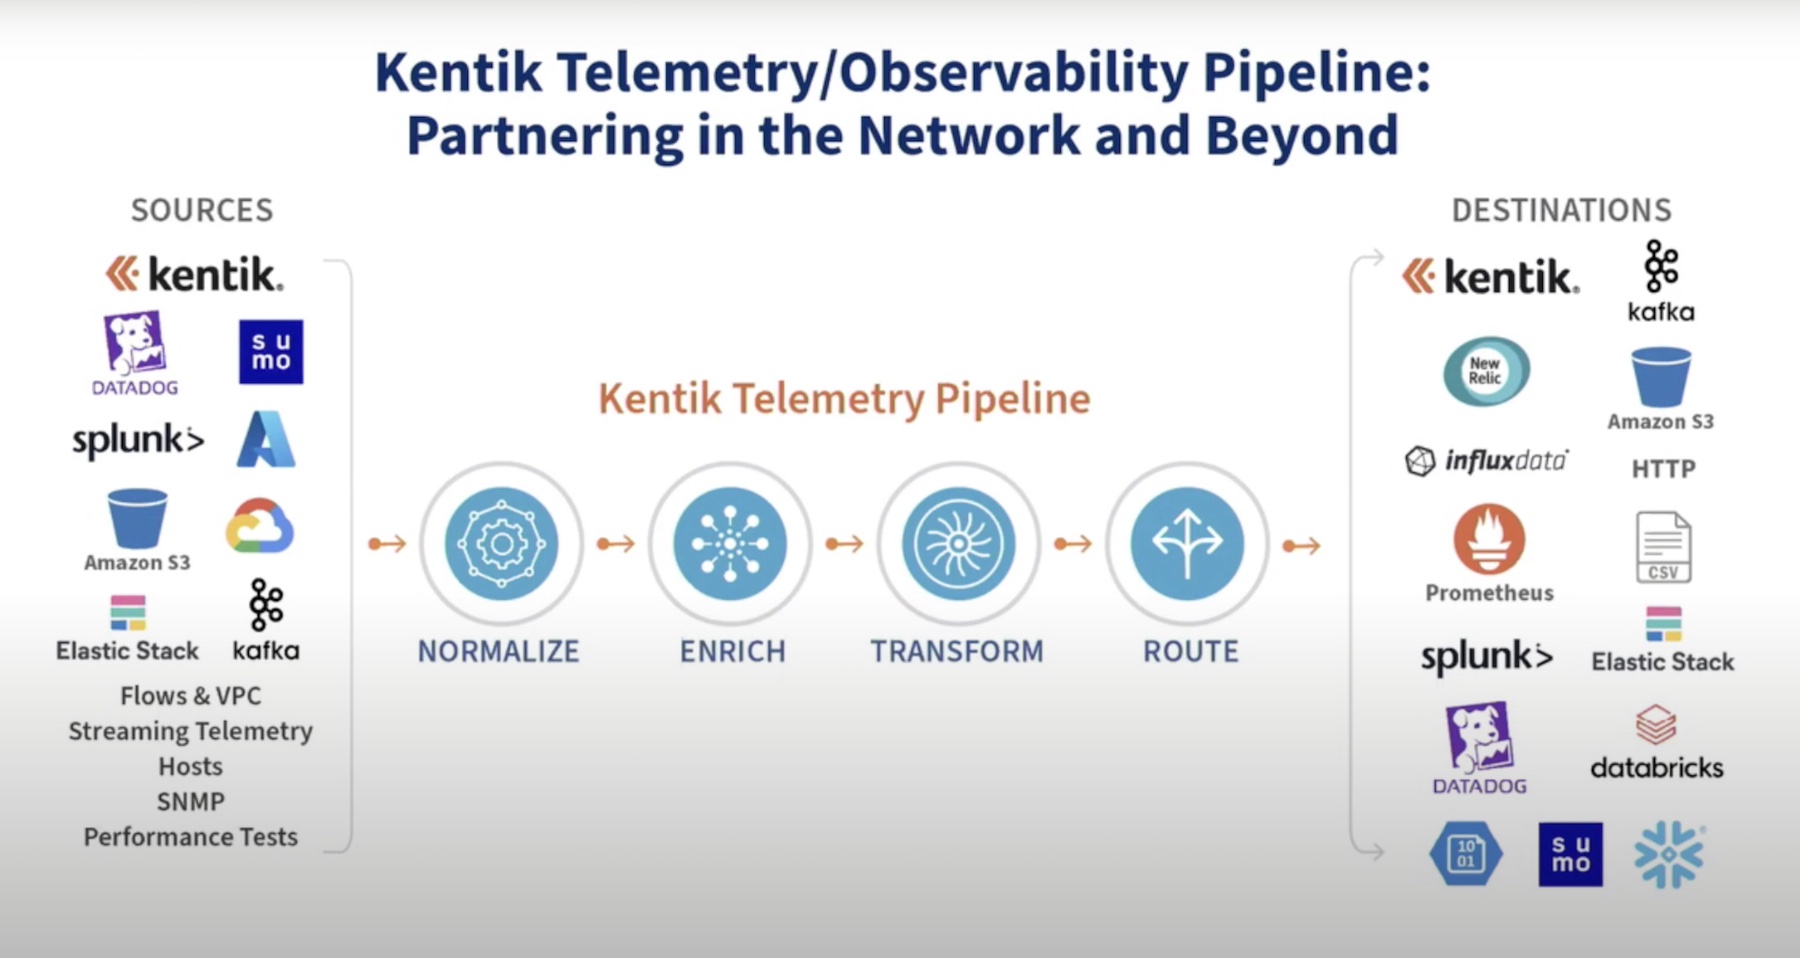
For deep observability, Kentik uses flow and VPC, streaming telemetry, hosts, and SNMP, additionally synthetic tests for active monitoring.
With a lot of good information buried in flow, Kentik started its journey by focusing on flow data, but soon realized that when dealing with distributed systems, no one type of telemetry answers all questions. So, they designed the platform to collect data like logs and streaming telemetry to help teams get to the root cause of issues faster.
Most enterprises face challenges planning for seasonal spikes. Kentik performs active monitoring with synthetic tests, through which it puts synthetic traffic on the network via an agent to test out the performance of the network giving engineers a way to be ahead of the game.

The platform integrates with a lot of data sources – Datadog, Sumo Logic, Splunk, Amazon S3, Kafka, and Google Cloud to name a few. On the output side, it pushes notifications out through ServiceNow, and send the data off to other systems including Splunk, Amazon S3, InfluxData, and Prometheus.
Inside the Kentik telemetry pipeline, data from disparate sources are aggregated and normalized, enriched with context, and transformed into deep analytics before published for a single view.
A key capability is fast and flexible query with context. The analytics Kentik provides drawing on the large volumes of telemetry data it ingests, enables teams to query back answers quickly.
More Features on the Way
The Kentik Network Observability Platform takes visibility to the next level providing teams meaningful information that helps monitor and troubleshoot the network. But Kentik is always testing new ideas and moving the research forward.
During the presentation, Mr. Ryburn informed that Kentik is currently working on building a full-on metrics platform to amend its light SNMP support. This will give operators a chance to dabble in the metrics, perform sophisticated comparisons and detect problems faster. Another capability that its working toward is events for correlation.
A project already in the works is adding a cloud topology for GCP. “For a while we’ve had some cool visualization for AWS and Azure. They can show you your regions, zones, how your network is actually built and designed in the public cloud,” said Mr. Ryburn. Seeing that the customers love those topology views, Kentik is now working on building out such view for GCP.
Wrapping up
With the network expanding in size and complexity every day, companies can’t afford keep their fingers crossed and hope for the best. Before they find themselves in the crosshairs, they need to proactively invest in a solution like Kentik’s that redefines visibility, making it easier to explore data out of the box, and delivers faster, accurate and rapid insights for directed troubleshooting.
For more information, be sure to check out the Kentik deep-dive presentations from the recent Networking Field Day event.

