Cisco’s incredible feat of developing cutting-edge networking solutions over the years showcases network engineering at its very best. But as we applaud the momentous advances and mind-boggling innovations from the sidelines, few of us know the science and engineering that fuel the efforts.
In a session covering the latest product updates, at the recent Mobility Field Day event, Sunmeel Bhumkar, Lead of Product Management, Wireless Experience at Cisco, took the audience behind the scenes of one of Cisco’s flagship solutions – the Meraki Dashboard.
Meet the New Unified Cisco Wireless
Cisco has a new business unit, Cisco Wireless, which up until recently used to be Meraki and Catalyst Wireless. Phal Nanda, VP of Products announced that the activities of the two units have merged on all levels of management, marketing and engineering. Moving forward, Cisco is focused on having a common management strategy, and this change takes effect in the Meraki Dashboard.
Bhumkar tagged team with Technical Marketing Engineer, Scott Irey, to give the audience a sneak peak of the Catalyst wireless controller page which is still in the early phases of development.
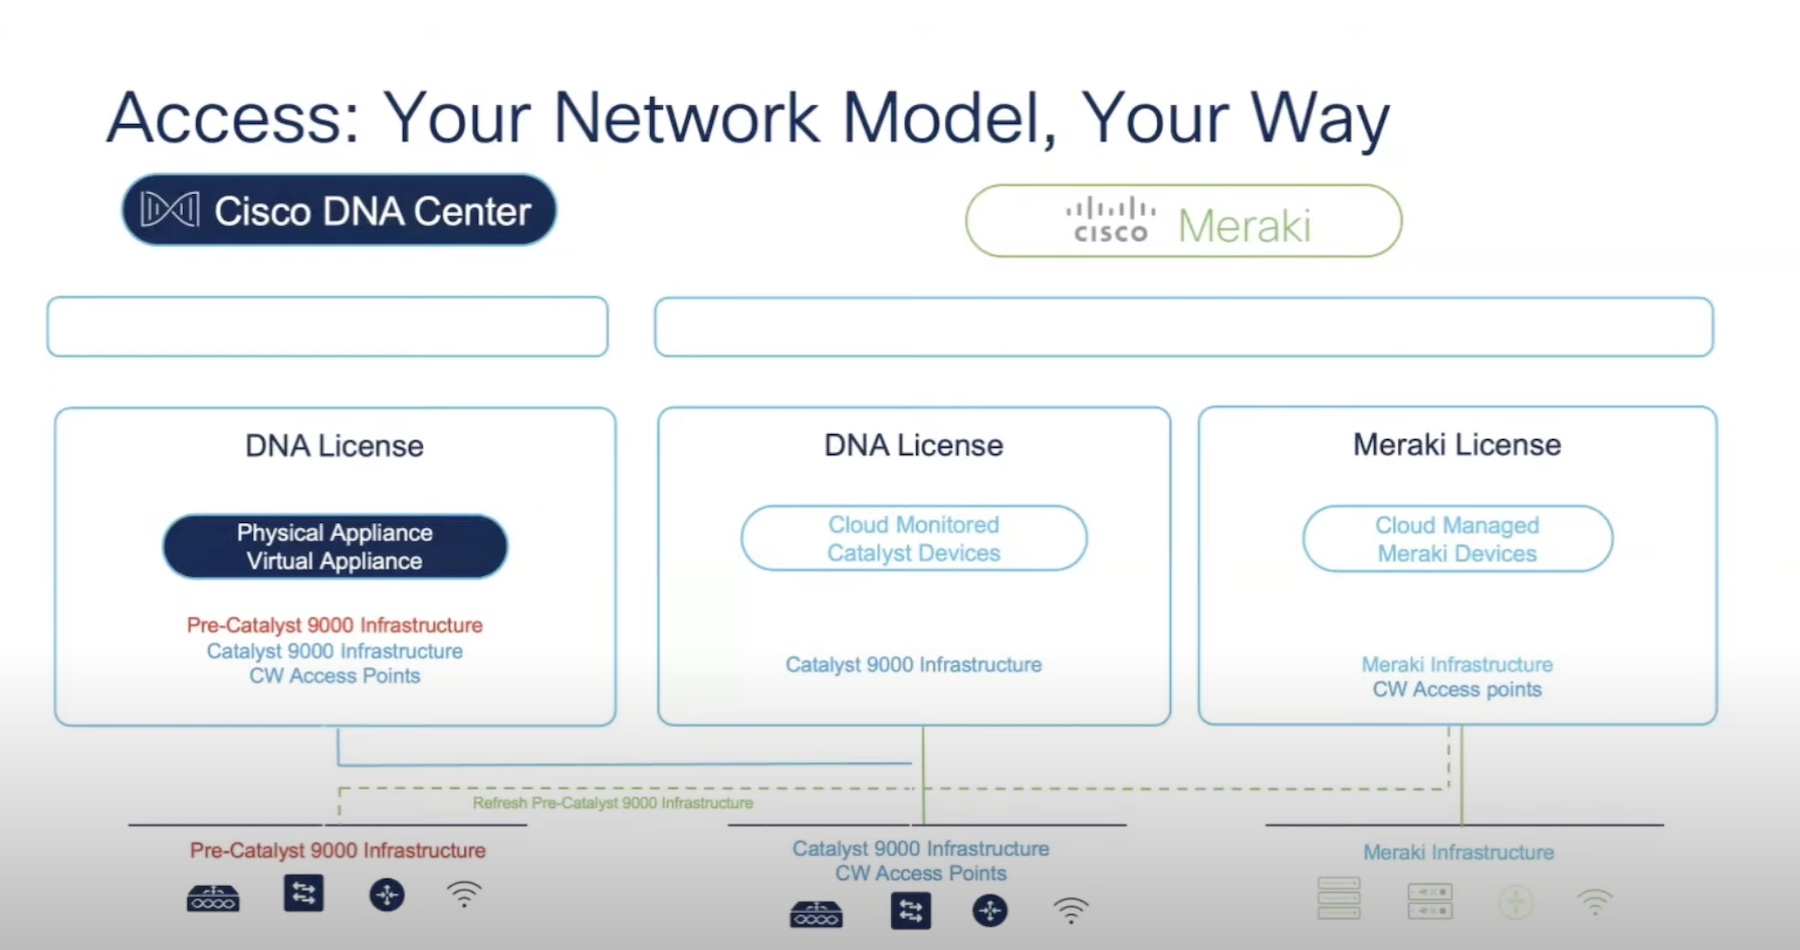
Customers have a choice – “Cisco has a large customer base that is going to have different consumption models. The market is moving towards cloud but not all of it will. Some customers are going to want to be on-prem, manage their own instances and for that we have DNA Center,” Bhumkar clarified before diving in.
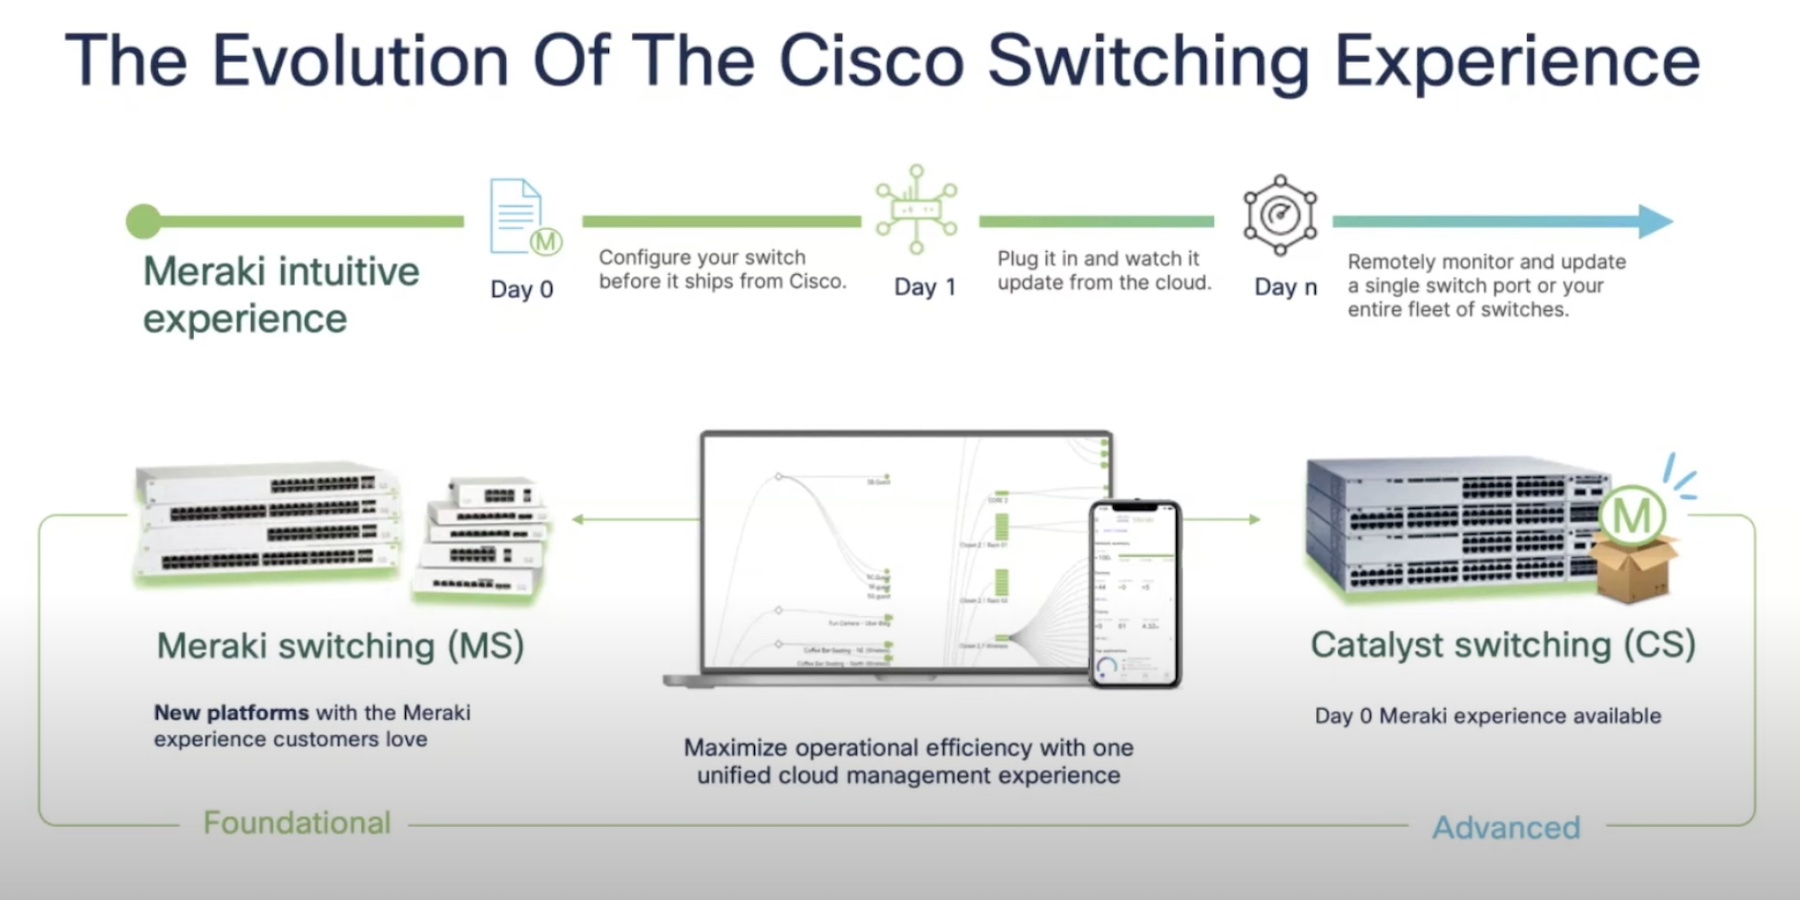
For those that are heading over to the cloud, the Meraki Dashboard will deliver a meatier experience as it brings together Meraki and Catalyst wireless.
“We’re trying to bring in functionality to have that warm handoff and that journey, because investment protection is big for our Cisco customers. So that’s definitely top of mind for us,” commented Bhumkar.
Through the Years
The Meraki line started back in 2006. Today, the technology has evolved dramatically growing in order of scale and magnitude every year, some of which includes migration to a microservices architecture, having hybrid footprint, and operating at a scale that spans the globe.
As the scope of General Data Protection Regulation widened in the recent years, with each country coming up with their own set of regulations, Meraki has switched up strategy to keep compliance.
This includes building geo clouds with dedicated clusters for individual data residency needs in different locations. Hosted in AWS, these regional clouds are available through the Meraki dashboard under specific country or region.
Cisco has also announced a full suite of customizable networking products for government organizations called Cisco Meraki for Government, recently.
“We are doing FedRAMP certification for Meraki Dashboard for our government customers. A lot of state and local bodies are also starting to think about FedRAMP and so we’re definitely working with them too,” informed Bhumkar.
Global Insights and Intelligence
In the past several years, the Meraki Dashboard has witnessed staggering growth. From having 1 million API calls, the number has shot up to 8 billion and counting. Today there are about 12.6 million Meraki devices deployed across 190 countries, and 195 million daily end-user devices.
Operating at this scale has brought tremendous potential for growth, expanding the teams’ understanding of how networks behave, how issues can be efficiently troubleshot and discover new solutions for countless industry use cases that can benefit verticals.
“As we know for wireless, every time we troubleshoot, we are dependent on the client devices making some decisions. This means we are dependent on some of the client driver behaviors and so it’s very important to understand how the client devices are behaving and having that much scale and visibility helps us deliver on some solutions,” explained Bhumkar.
Broad Visibility to Ensure Quality
Customers tap into the automation capabilities of the Meraki Dashboard to address a diversity of industry use cases. They leverage it to build solutions on top of it, and explore data out-of-the-box, because the values of the Meraki Dashboard far exceed those of a typical management platform.
“There is a lot of automation that customers are doing with the Meraki Dashboard, so much so that they’re drop-shipping equipment, scanning devices and just deploying it.”
But more and most, the Meraki Dashboard provides a highly effective and efficient means for Cisco to see deep into the heart of networks. “One of the things that it allows us to do is gain visibility into customer networks and use that data to help our customers,” said Bhumkar.
Through the Meraki Dashboard, Cisco pulls data from 12 million online Meraki devices that it puts to use to design solutions and run automated tests.
“We have around 20/30 APs that we are actively supporting and every time we roll out a code we need to make sure that they are working well.”
Tests are performed to ensure smooth deployment, and examine interoperability of the APs so that the codes work at scale.
“As the Meraki Dashboard scales, these things are also scaling behind the scenes because intelligence is not something that you only see in the dashboard. Tt’s also how we operate,” said Bhumkar.
With that resolution, the teams can probe into trends and patterns, and keep up-to-speed with reported events and anomalies,. This enables them to proactively reach out to customers with patch fixes when anomalies crop up unexpectedly.
Cisco tunes in and gathers feedback of firmware updates to ensure quality for customer deployments. All firmware GA, beta releases, new features and rollbacks are traced and monitored to gain meaningful information that can enhance product stability.
“As we look at the feedback, our AI engine does an NLP analysis and then if we start detecting any trends or anomalies, we do a proactive investigation and an outreach.”
In many cases, this has allowed the backend teams to identify issues that are exclusively impacting a set of customers and remediate them.
“Using the firmware rollout algorithm that we have to detect anomalies at scale allows us to look at what is happening because at the end of the day when there is a new firmware release, there is somebody that gets a call next day saying my Wi-Fi was working well yesterday but now it doesn’t,” said Bhumkar.
To optimize the scope of visibility, Cisco has cast a wide net through industry partners that include big vendors like Samsung, Apple and Intel. Through these brands, Cisco gets analytics, charts and graphs about things of interest like Splash page behavior, device and AP issues, firmware behavior and more, from devices that are connected to the Meraki Dashboard.
Wrapping Up
There is no denying that cloud networks produce an absurd amount of noise, but harnessed, it can yield eye-opening patterns and trends, golden prompts, and helpful insights that can dramatically improve the abilities of a solution. The way Cisco has leveraged the observability it has achieved through the Meraki Dashboard is exemplary, and the secret to unlocking incredible transparency and control over deployments and consumption. It has allowed the platform to detect outliers, perform sophisticated comparisons, and make predictive analysis, helping teams find signals in the noise. It has made networking easy and future-proof.
To know more about the Meraki Dashboard experience, watch the demo in the second half of this presentation from the recent Mobility Field Day event.