Nurturing an ever-expanding network in a way that it is up and up 99.999% of the time is a harder problem than it appears. Network teams working behind it know the harsher reality because they have to get around the pitfalls that lay in the way of the 5 nines uptime every day at work.
At the recent Tech Field Day event, Kentik presented Synthetic Testing, a capability they included not long ago to the Kentik Network Observability Platform. Kentik Synthetics helps network teams stay ahead of problems by simulating network behavior, and proactively evaluating variables and the health of the network.
An Incomplete Picture
The language around network monitoring has evolved at a faster pace than the technology itself. In the last couple years, vendors have swapped out the older and outdated “monitoring” with the more scientific sounding “observability”. And although “observability” has become the stamp of distinction for vendors, under the hood, the technology has remained the same, give or take.
Teams still base their decisions on flow records when that data, in and of itself, is not valuable without context. Looking at one piece of data and drawing conclusion out of it is not the savviest way to infer the health of a network as complex as those today. Without context, one can very easily make wrong, or even ridiculous deductions.
A Richer Data
Contextual data, on the other hand, is the cornerstone for making confident decisions. But there’s an even better way to bolster observability. With proactive monitoring, engineers can weigh the digital experience of the users before it is delivered.
Monitoring tools that do not function proactively doesn’t help avert outages, nor help improve the Quality of Experience (QoE). It’s an important lesson, CTOs have learned through frequent network disruptions, and that’s why there’s a keen and growing interest in proactive network monitoring.
Achieving Observability of Digital Experiences
Kentik does not need a lengthy introduction in the context of network monitoring. It’s high rating and heaps of reviews on popular platforms like Gartner for example, confirm its golden reputation.
For Kentik, observability is to be able to answer any question that network engineers might ask. So when it saw a growing void in the performance monitoring capabilities coming from certain hardware vendors, it embraced synthetic testing to stop that gap.
Mike Krygeris, Enterprise Solutions Architect, informed that proactive monitoring is not a common feature-set in network hardware. “A lot of routers and switches don’t want to take on that sort of workload in order to get performance data,” he explained.
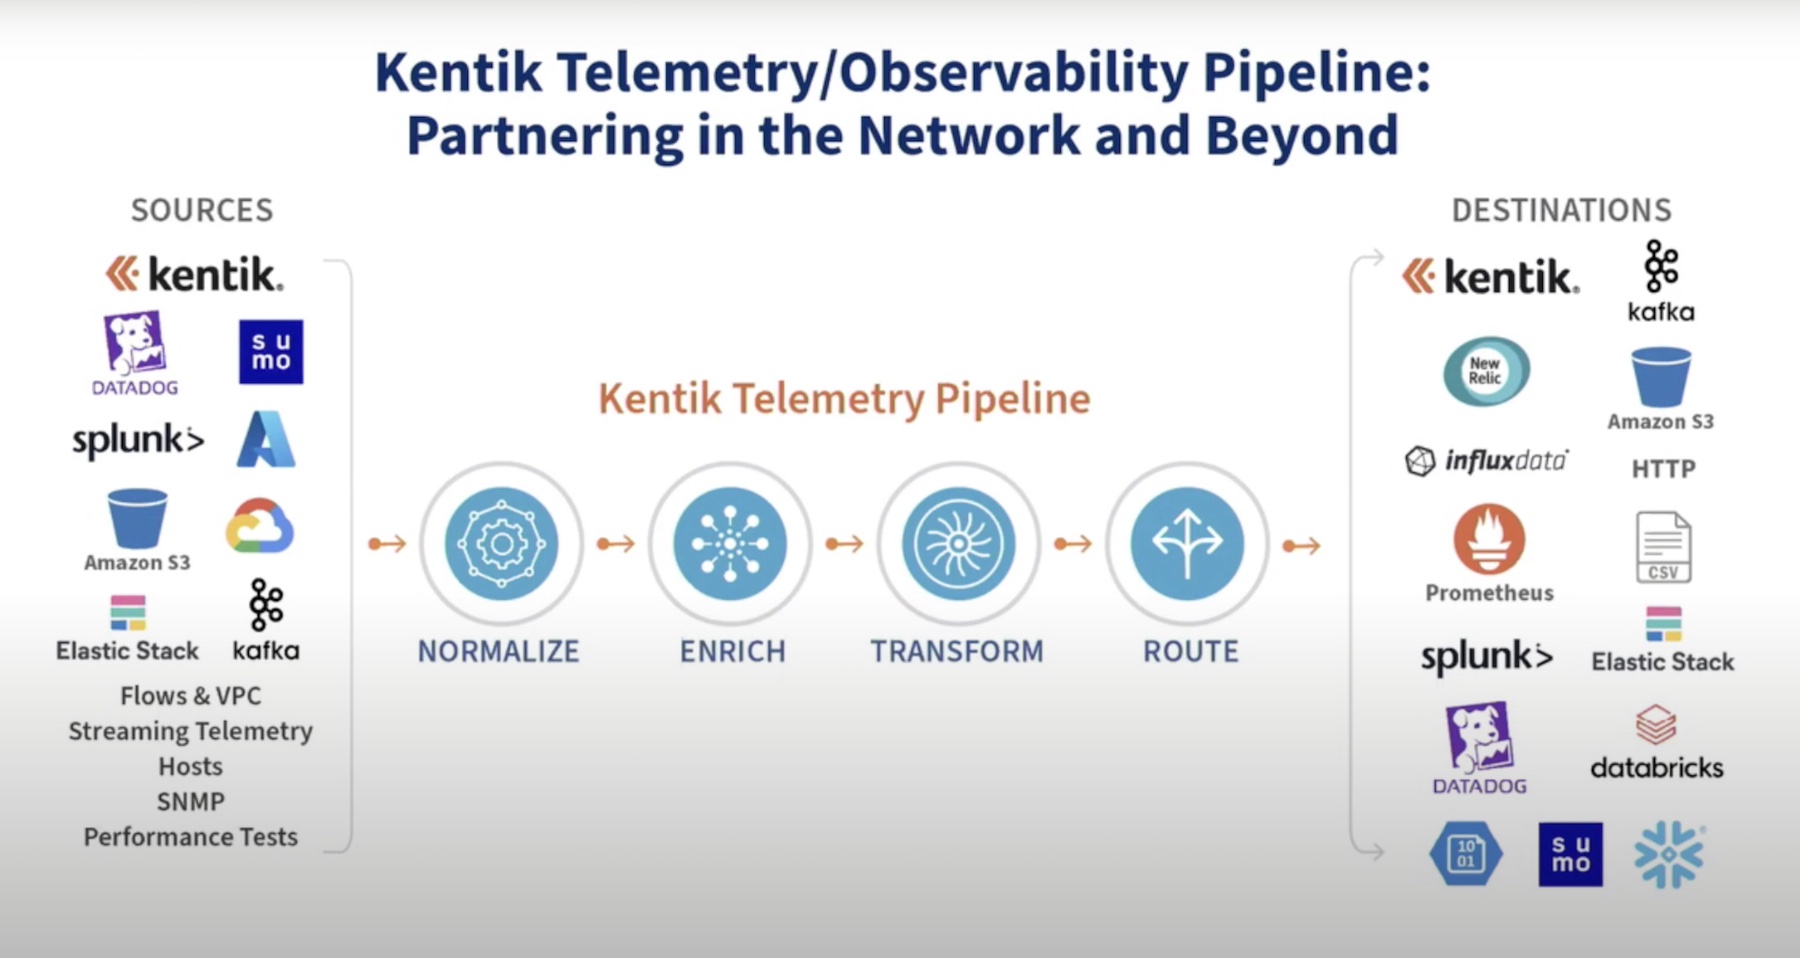
The Kentik Network Observability Platform ingests data from data sources, adds context to it by enriching it with metadata from the network, and presents it to the teams. Delivered as SaaS (Software-as-a-Service), the platform is vendor-agnostic, and can gather data from any source in the network.
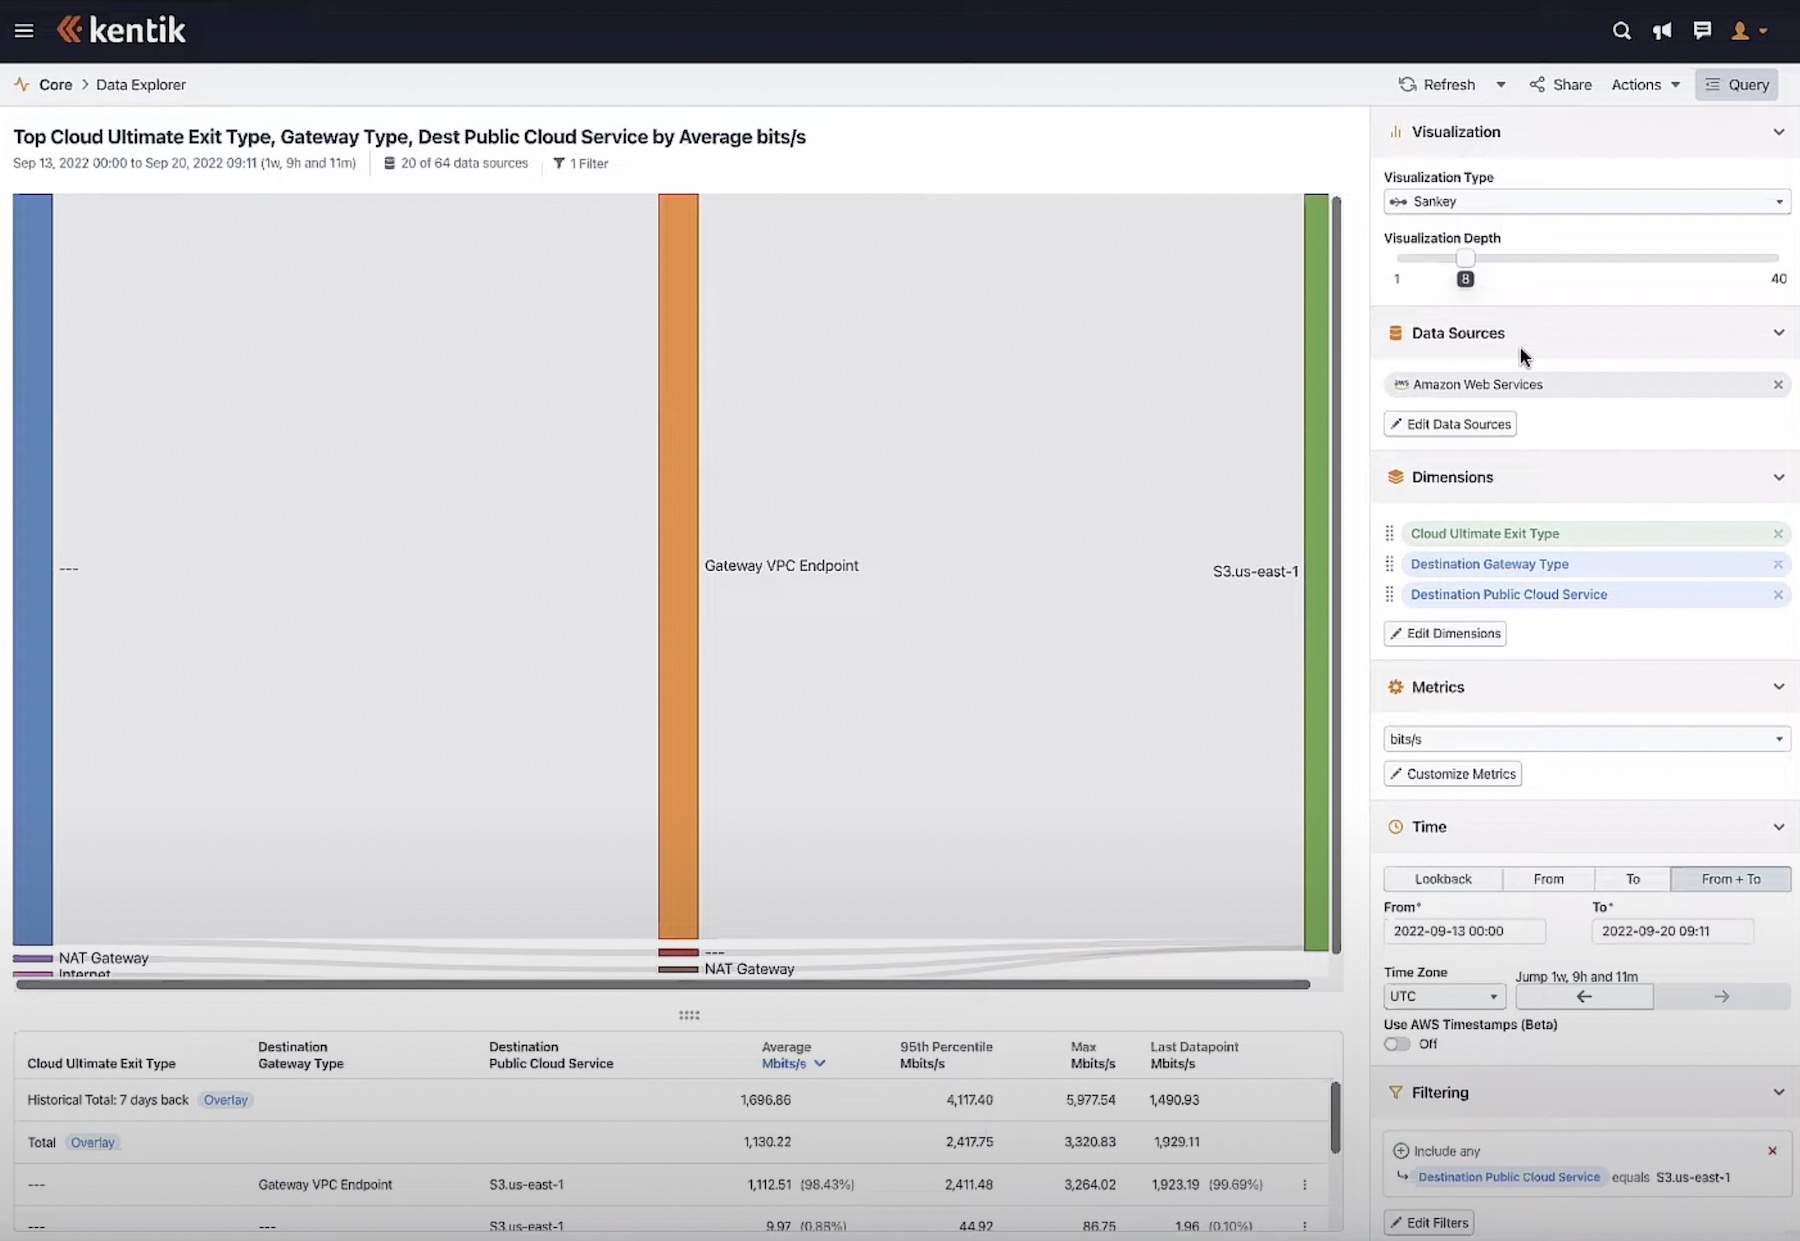
The other function that Mr. Krygeris drew attention to is low-latency query. Kentik Network Observability Platform allows users to query data at a fast speed, so that information is always at the fingertips. It also provides automated insights for easy troubleshooting.
Kentik Synthetics
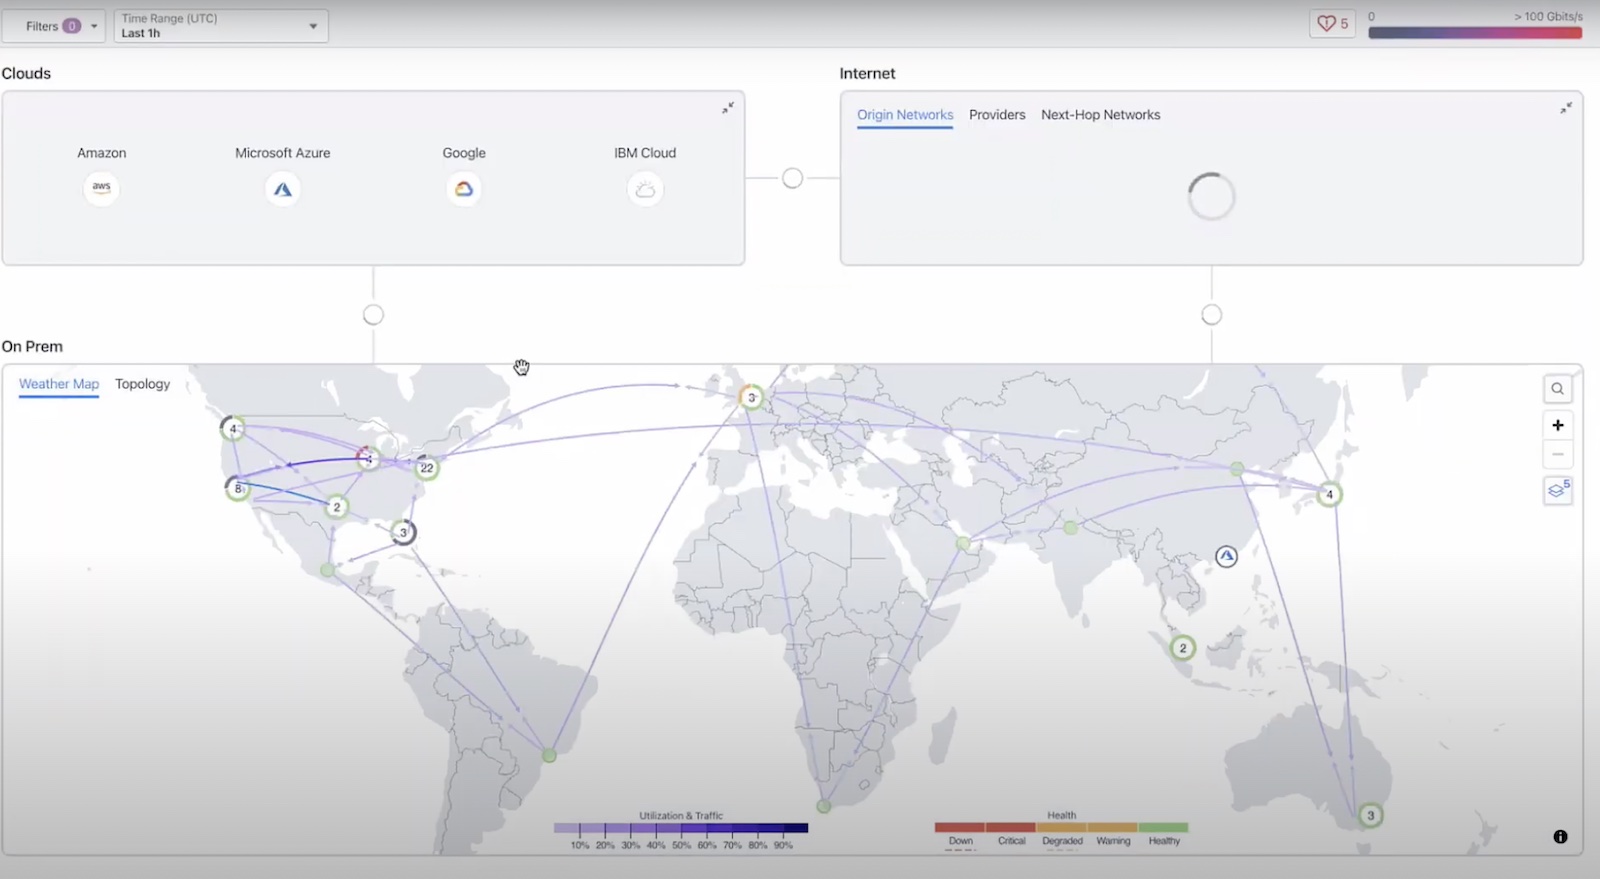
Mr. Krygeris walked the audience through the capabilities of Kentik Synthetics. Kentik deploys agents all over the network, be it cloud, or on-prem, that watch the network from different vantage points in the environment. Users can schedule synthetic tests from the Kentik UI. Tests can be scheduled at a frequency of a few seconds to every minute or longer.
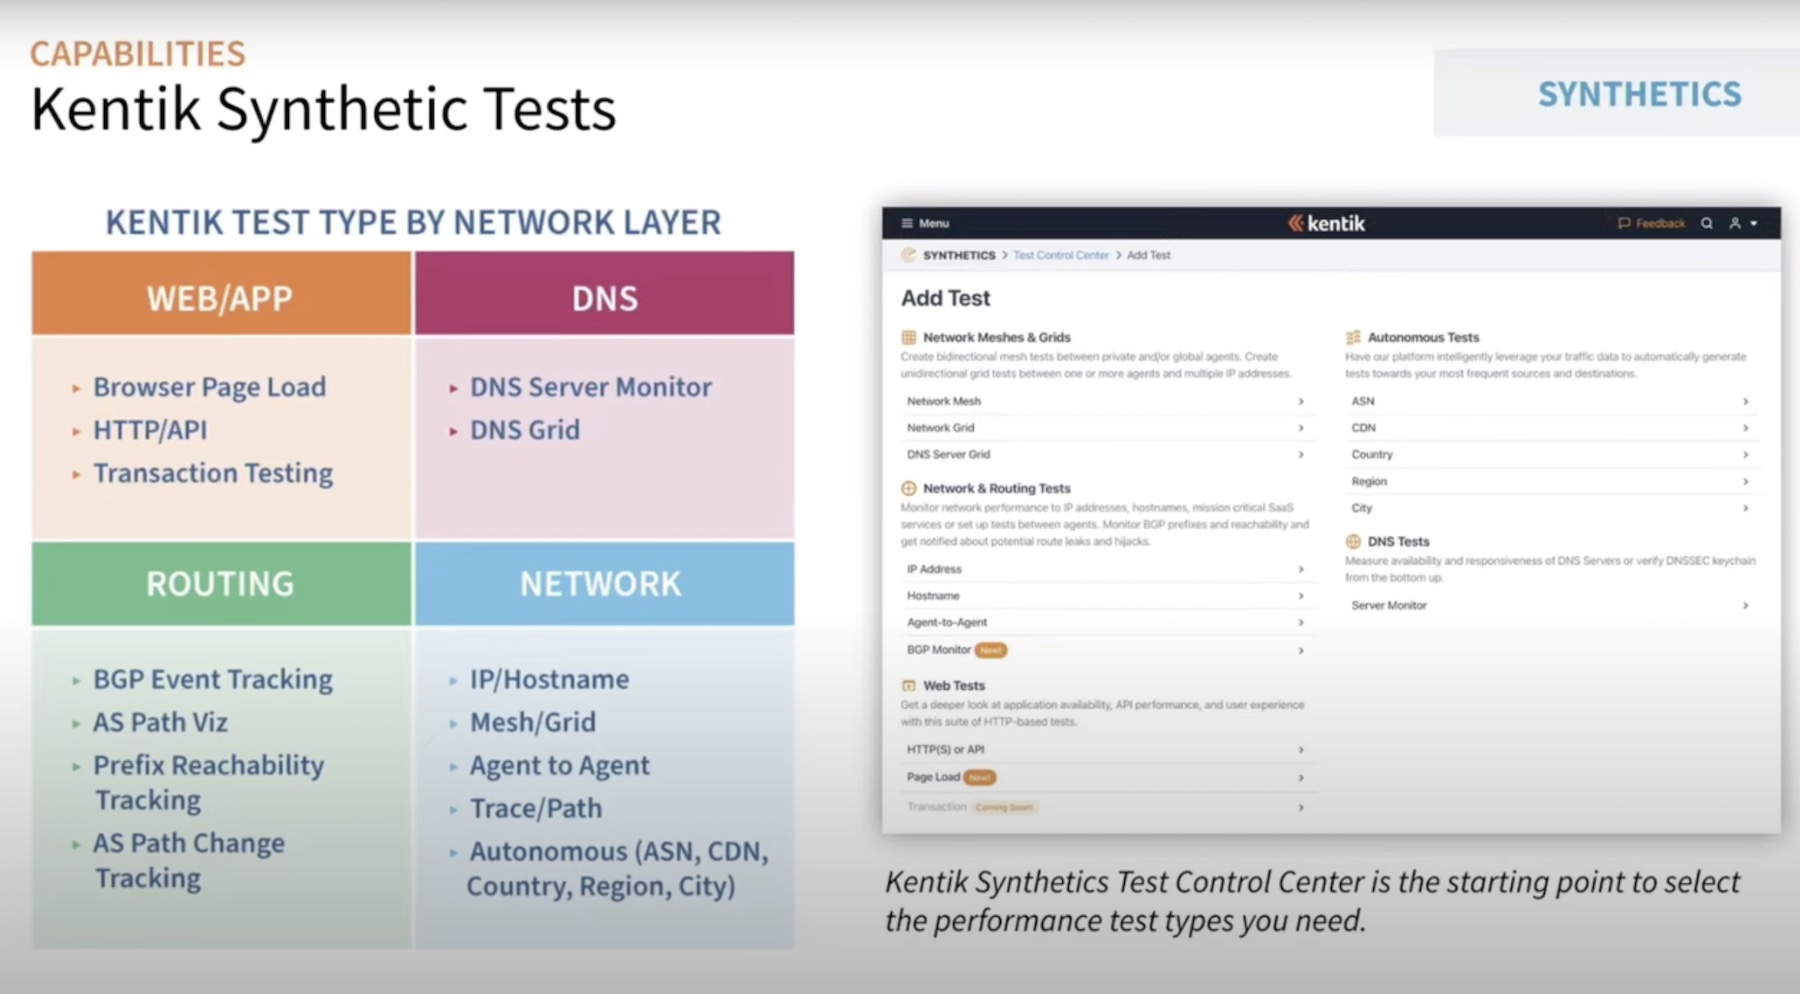
Kentik Synthetics Test Control Center provides several options for users. They include but not limited to Network Meshes and Grids for monitoring with agent-to-agent meshes, Network and Routing Tests for monitoring with one or a set of agents, and Web Tests for measuring the response time of Web servers.
Kentik covers a lot of grounds when it comes to performance monitoring. Mr. Krygeris named some of the testing that Kentik does, such as ping, traceroute and jitter tests, TCP and UDP, DNS testing, app testing and Internet health and BGP monitoring.
Kentik Autonomous Tests analyze flow records and correlated traffic data, triaging problems on auto-pilot. Through these tests, teams can keep up-to-speed with the network performance, and application response times, while closely watching the supporting infrastructures, with just a few clicks. High traffic and path awareness ensures swift Root Cause Analysis (RCA) and shorter Mean Time to Repair (MTTR).
Wrapping Up
Organizations are fast embracing new cloud environments and that is making the network topology a little more complex every day. Companies that continue to latch on to older techniques of monitoring, waiting for problems to surface are already too late. The modern networks require tools that can proactively probe into the components and interact with them just as a real user would, and spot the problems before they do, leaving no mystery for the teams. The Kentik Network Observability Platform with Kentik Synthetics is one such solution that measures digital experience from the point of view of the users, and provide teams the 360-degree visibility they require to achieve the 5 nines uptime.
To check out the demo, be sure to watch the above presentation till the end, or view other deep-dive presentations by Kentik from the recent Tech Field Day event.