Network operations is a jumble of activities, that have one common purpose – to keep the network available and preforming. A big part of that is responding to alerts, but excessive alerts can very easily become exhausting, and disruptive to the day-to-day operations. At the recent Mobility Field Day event, Ruckus Networks presented RUCKUS Analytics, a network analytics and assurance service that dials down the alert noise and enables quick time to respond.
Turning Down the Incident Volume
The traditional NMS (Network Management Station) way of looking at anomalies is antiquated. It gives the admin teams all the data but very little interpretation. It generates way too many alerts and that is not helpful for network engineers. Momentary jitters, minor deviations, and such issues are just part of the network entropy and frankly do not require anybody’s attention or involvement. Most of the time, they are non-issues and can resolve on their own. Sending out alerts for such events is a waste of the administrators’ time.
Instead, what the network team needs is a solution that can intelligently observe, detect, probe and filter issues so that they only get alerts for the things that can potentially become a problem and require remediation. Only then the alert noise can be minimized and without the distraction of routine alerts, the teams can return to the tasks that are more urgent and vital.
A Solution That Can Think on Its Own
Ruckus Networks is networking company whose mission statement is to be purpose-driven – to be bigger than its products and services. Rajiv Iyer who is the Sr. Director of Product Management, Ruckus Networks, CommScope lays out that the company goal is – “Using the data that we have to make it more operationally effective and helping the line of business decision makers with that data.”
In RUCKUS Analytics, Ruckus Networks has built a solution that can reduce the level of noise through intelligent analysis. Programmed with sophisticated AI algorithms, RUCKUS Analytics is a cloud service that delivers holistic visibility into network operations through analytics and assurance. Ruckus Networks’ purpose behind designing this service is to minimize MTTR (Mean Time to Respond) and accelerate troubleshooting.
Originally a tool to solve the problem of network analytics and assurance, it is a bit different than most tools of its kind, in that RUCKUS Analytics has the add-on capability to deeply study the nature of incidents and establish a baseline. It can determine if it’s an isolated instance, or a systemic problem, categorize it correctly, aggregate all of that data and based on that, issue a ticket with to-the-point information, only when required.
Ruckus Analytics – An AI Powered Service for Network Analytics
At the recent Mobility Field Day event, Iyer showcased RUCKUS Analytics. In the video below, he talked about the fatigue and distractions caused by high alert noise and how Ruckus Networks eliminates that by approaching network analytics with AI.
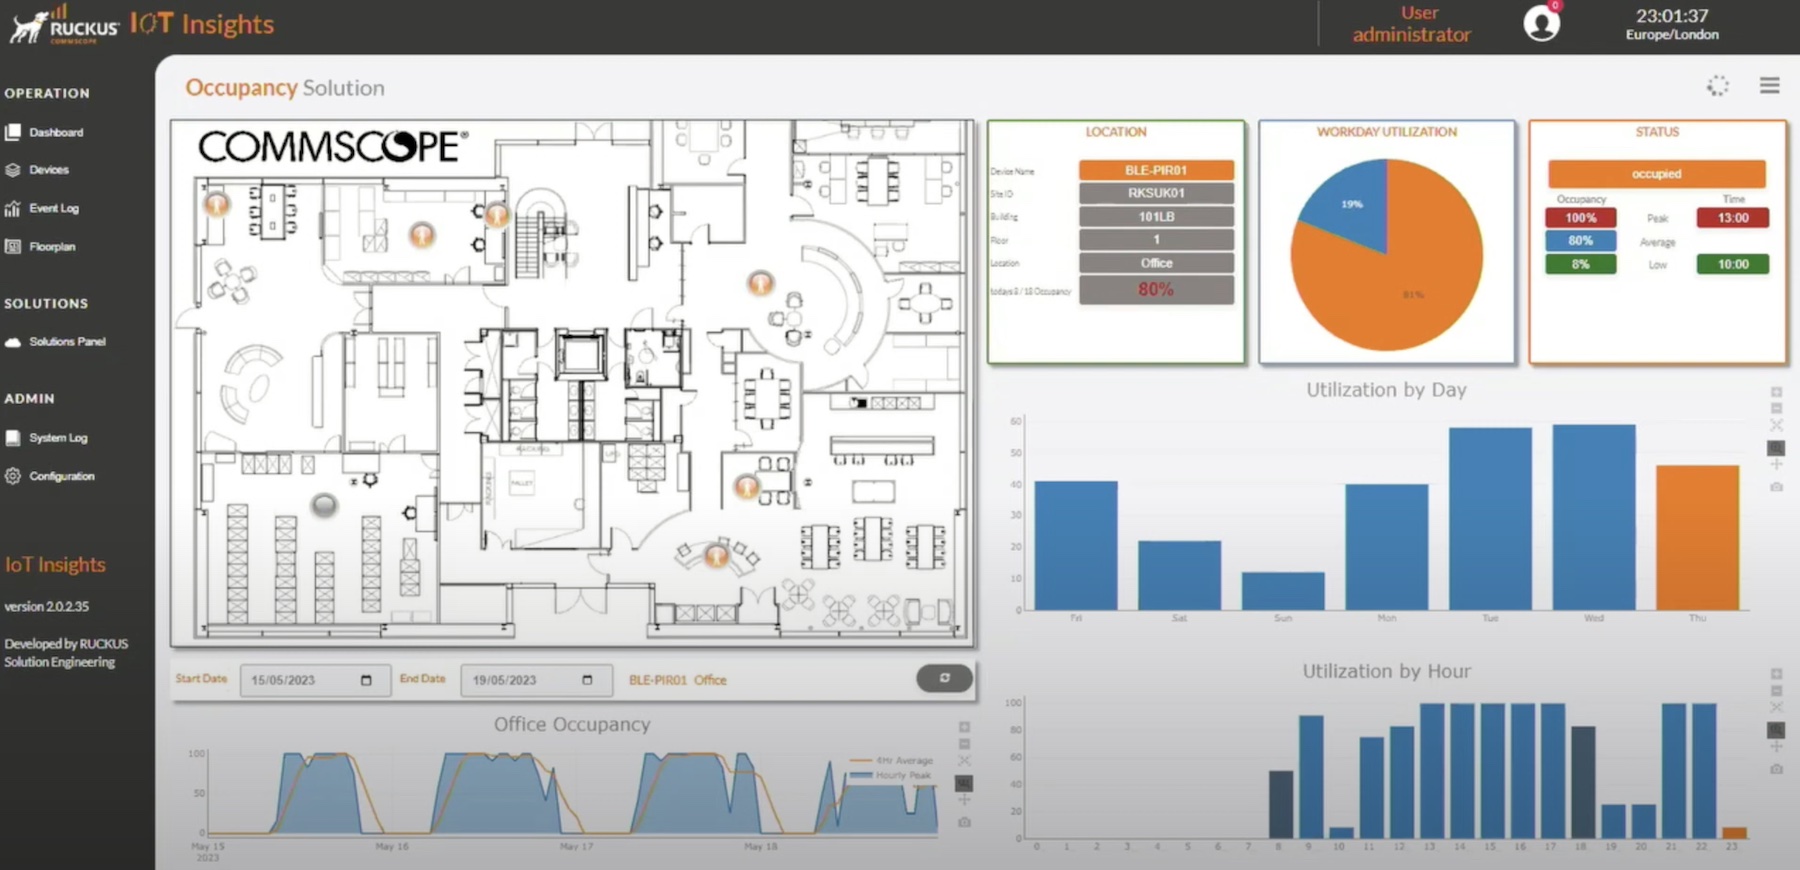
RUCKUS Analytics has an intuitive dashboard that displays information in a cohesive and comprehensive view. At the center is the network graph and the metrics, namely Severities, Categories and Listing are lined up on the right side of the board.
The Network page under AI Analytics is dense with information about connection health, APs, switches and clients, total incidents and incident details like severity level, duration and category. On it, users can find insights like Root-Cause Analysis (RTA) and troubleshooting recommendations for every incident recorded. The page holds a wealth of information on failures and causes, accessible with just a few clicks.
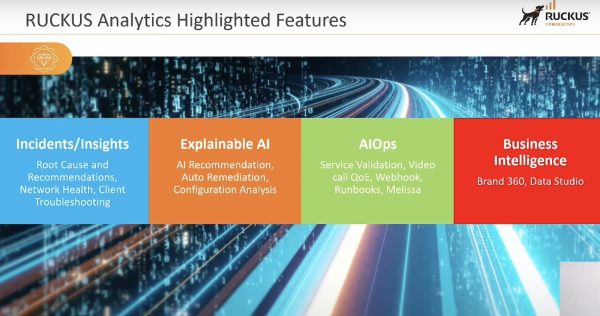
RUCKUS Analytics delivers a full Comparison Report viewable under Report. This report tells IT teams about the status of RF configurations. The recommendation engine is another important feature in RUCKUS Analytics whose function is to issue recommendations for network optimization. RUCKUS Analytics adds together information from its knowledge graphs and queries and 18 KPIs to learn the dependencies and figure out what parameters can be played with and how they can be tweaked to achieve better network performance.
With a before and after view that is based on Google’s Canary Analysis Service, IT teams can identify the ways in which changes affect the network. Users can test their Zoom call quality and get results on the Video Call QoE page. AI-powered virtual assistant Melissa fetches statistics and delivers responses with advanced NPL (Natural Language Processing) making sure that administrators don’t have to write code for everything.
Wrapping Up
RUCKUS Analytics is clearly a strong service that can not only take a comprehensive look at the network, but also proactively identify and eliminate root causes of issues. It’s a solution that can think and answer questions by itself and takes intelligent decisions about whether something is worth bringing to the attention of the IT teams or not. It can examine symptoms that compromise the performance of the network, trace them back to what’s causing them, compare anomalies, filter out alerts and turn down the noise, ultimately restoring healthy network operational levels.
Be sure to check out the other presentations by Ruckus Networks at the recent Mobility Field Day event to know more about RUCKUS Analytics and other network solutions.