I recently wrote about Catchpoint’s presentation at Network Field Day 29, That blog compared Catchpoint to some competing products or at least other products that include some similar capabilities. Catchpoint’s stated goal is to be the Best at Internet Resilience.
This article provides a mildly deeper dive into products’ relative capabilities, and then looks at Catchpoint from the Internet Monitoring and Resilience perspective, trying to answer the question: What are the top differentiating capabilities Catchpoint provides for Internet Monitoring, etc.?
We’ll finish up with a Troubleshooting Use Case walk-through, looking at how the readily available reports in Catchpoint solved an actual SaaS app slowness problem.
Network/App Response Monitoring Products
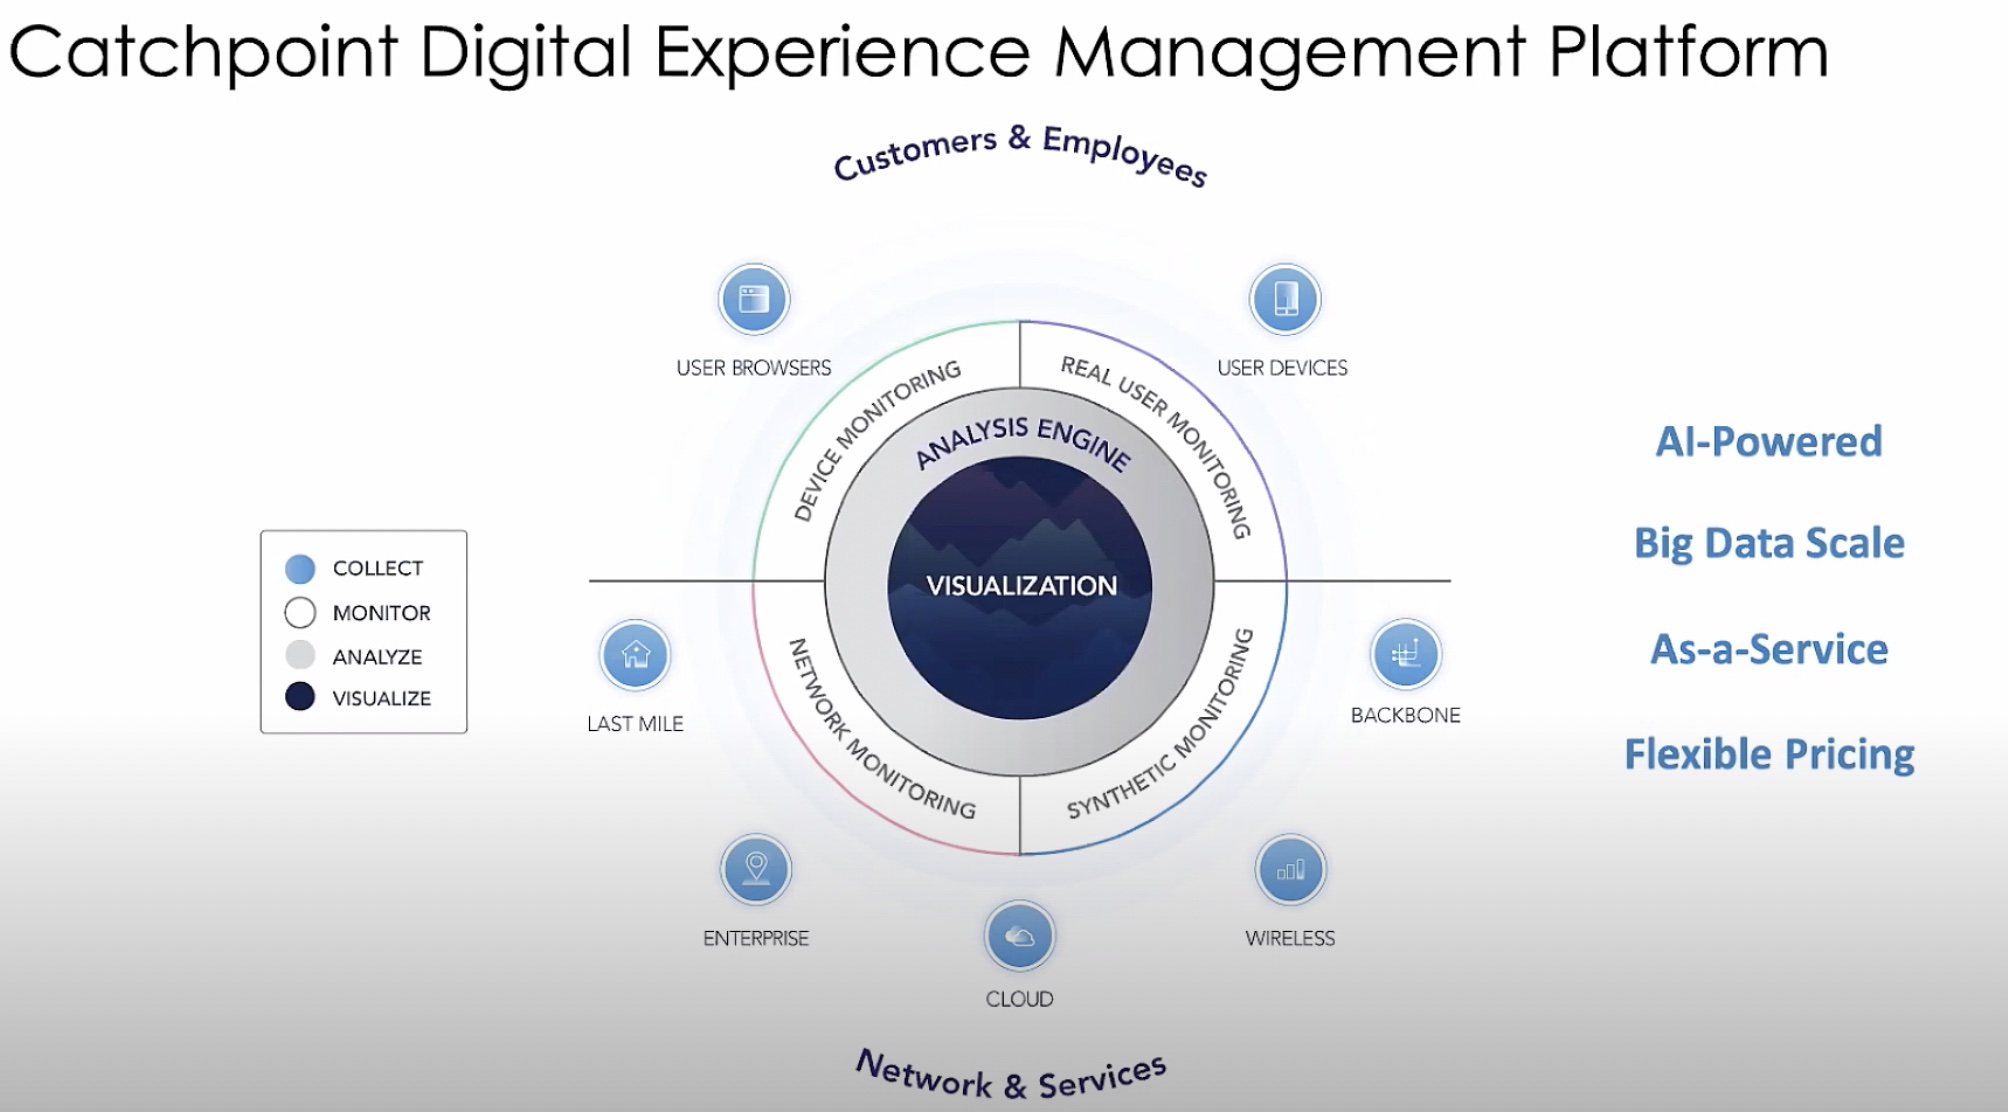
In the network and application performance monitoring (etc.) space there are several products. There are overlaps in some or many capabilities, but it can be hard to tell the products’ capabilities apart. However, Catchpoint differs in that it’s a solution that monitors your entire internet stack, rather than just applications and network traffic. To that end, it’s focused on the experience of the user through the entire digital service delivery chain.
Catchpoint’s Positioning
Catchpoint’s intent is to be the best at Internet Resilience (including monitoring and reporting) overall.
That’s quite a goal! The word “resilience” suggests “fast troubleshooting” to me, but in this context it’s about developing a comprehensive monitoring strategy that enables predictive insights, contingency planning and continuous improvement over time. A company with a resilient internet should be able to proactively deal with issues before they impact their users and be able to implement alternative paths that prevent outages. We’ll take a look at how they do that below.
Why Best at Internet resilience? Well, just about everything lately depends on the Internet. Especially delivery of Internet application content to customers and WFH staff. Or Internet access to office apps from home or while travelling.
Datacenter, CoLo, and Cloud traffic between apps and data storage may travel over dedicated links. But dedicated links are subject to much less variability. So, the entire Internet is the bigger challenge, and requires an application focus. Catchpoint of course handles other types of links as well.
What are the Top Catchpoint Internet Capabilities?
I asked Catchpoint about this: what are the top Catchpoint capabilities regarding Internet Resilience?
The answer:
- Catchpoint has the most global monitoring points for customers to leverage. At the time of this writing, (2022) Catchpoint has over 2000 vantage points across the Internet, including monitoring points in China which makes them less impacted by the Great Firewall.
- Catchpoint can do outside-inwards monitoring/troubleshooting, e.g., from the desktop of a user travelling in Dubai having problems accessing corporate apps or SaaS. This can provide data on problems invisible to competing products.
- Catchpoint provides focus: monitoring, reporting, and alerting on issues you care about. E.g., the latency of an application to, say, 3 locations. It does RUM (Real User transaction Monitoring if desired. It also does synthetics. I’ve been cautioned that “synthetics” means different things to different vendors. Catchpoint can do basic RUM (web URL request components: DNS, connect, SSL establishment, wait time, etc.). Or “synthetics 360”: deeper dive diagnostics, providing developer support. (For more on this, see also this set of web pages.) Catchpoint monitors key statistics Google uses to score websites. And Catchpoint has plug-ins for the Chrome and Edge browsers that can capture additional useful data.
- Catchpoint reports “User Sentiment” – monitoring third parties for user comments, down detection, etc. In other words, reporting on external perceptions of performance as well as the hard network performance data points.
- Catchpoint includes an Internet Weather Report and can monitor as much or as little of the Internet as the customer wishes (and wishes to pay for).
- Catchpoint is independent, not tied to a hardware vendor or other functions. It is agnostic about your network, server, cloud, CoLo, and other brands.
- Expertise. Catchpoint includes consulting services by a value engineer and a customer service engineer to new customers. This ensures identifying key use cases, setting up data collection, and demonstration of how to use the various relevant reports Staff augmentation or further consulting services are also available.
What else makes Catchpoint different aside from its enormous global observability network? One item mentioned is finer data granularity, with no limit on retention.
Note also that Catchpoint has a lot of basic to intermediate documentation about various skills relating to monitoring and troubleshooting. This includes some good how-to documents.
About Catchpoint’s Measurements
Catchpoint’s “web RUM” allows monitoring of the various components of a web-based application. Consider that such an application might have multiple global users accessing micro-services scattered around various sites.
Public-facing web apps require many Internet services. That starts with DNS, but includes Content Delivery Networks (CDN’s) as well. If their response is slow, the application experience will be degraded. One common potential problem is mis-configured global CDN services, where a user is hitting a CDN in remote location, rather than a closer one.
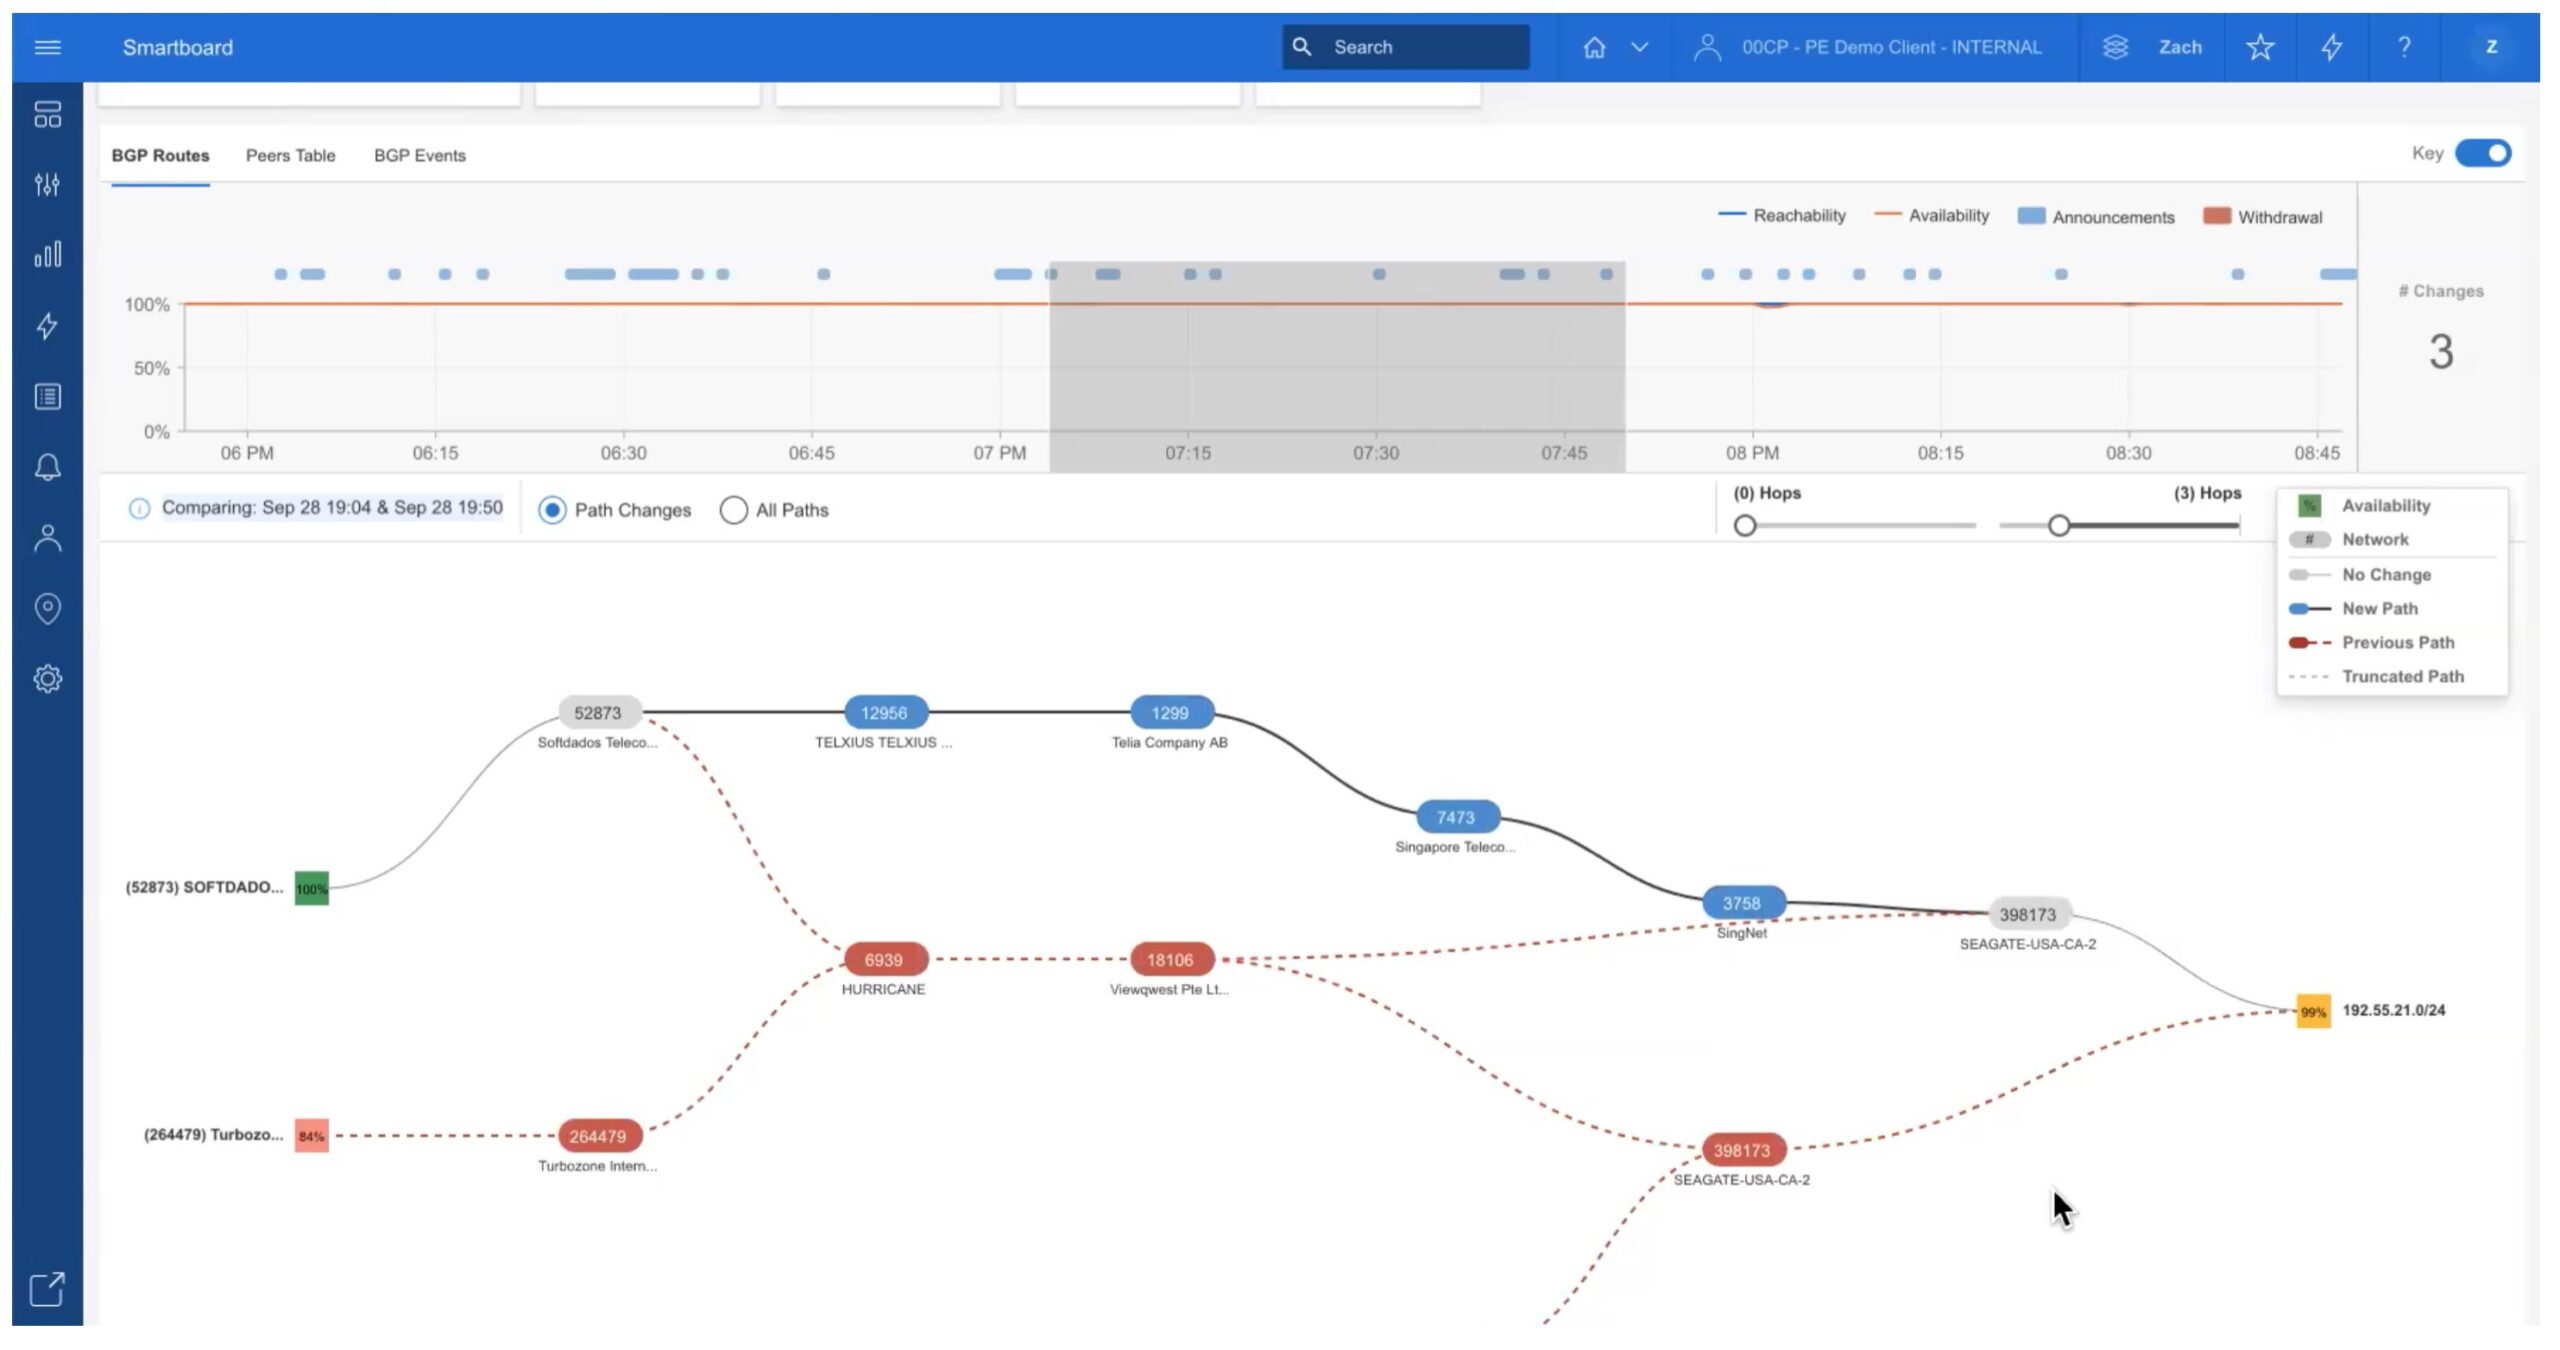
Another key set of measurements relate to Internet path. What path is a given user’s or site’s traffic taking, and is some segment of that path performing poorly?
In relation to Internet path, BGP is of course of major interest. Monitoring BGP peering, Internet paths for various IP prefixes, etc. is important. Catchpoint’s capabilities around BGP and Internet paths will be discussed in a follow-on article.
Catchpoint does also provide end-user WiFi and other monitoring for user-centric problems. But that’s a topic for another time and article.
The reason we use networks is of course applications, in the broad sense. Catchpoint can monitor:
- DNS
- CDN’s
- BGP
- Voice (VoIP) and video quality
- SaaS apps (like Salesforce)
- Cloud apps (like Teams and Zoom)
- API’s
To sum up, Catchpoint monitors web application and component performance.
One valuable use of Catchpoint is working with the application owners to determine the slowest components to load, with the objective of speeding up page loads.
The following example walks through troubleshooting an actual problem. One consequence of finding the cause might be a change in the web page to improve performance under adverse conditions.
Internet Troubleshooting Example
I’m a classic techie: show me some details! I hope you feel the same way. Let’s look at some detail!
Catchpoint walked me through a real-world example. They have a SaaS CRM app that we won’t name used by some of their staff. (Note: all of their staff is WFH, Work From Home or wherever.)
The app had some problems. This section showcases the data provided by Catchpoint. We start with an overview page.
Notice the first “tile”, top-left in the following screen capture (I added the red rectangular border).
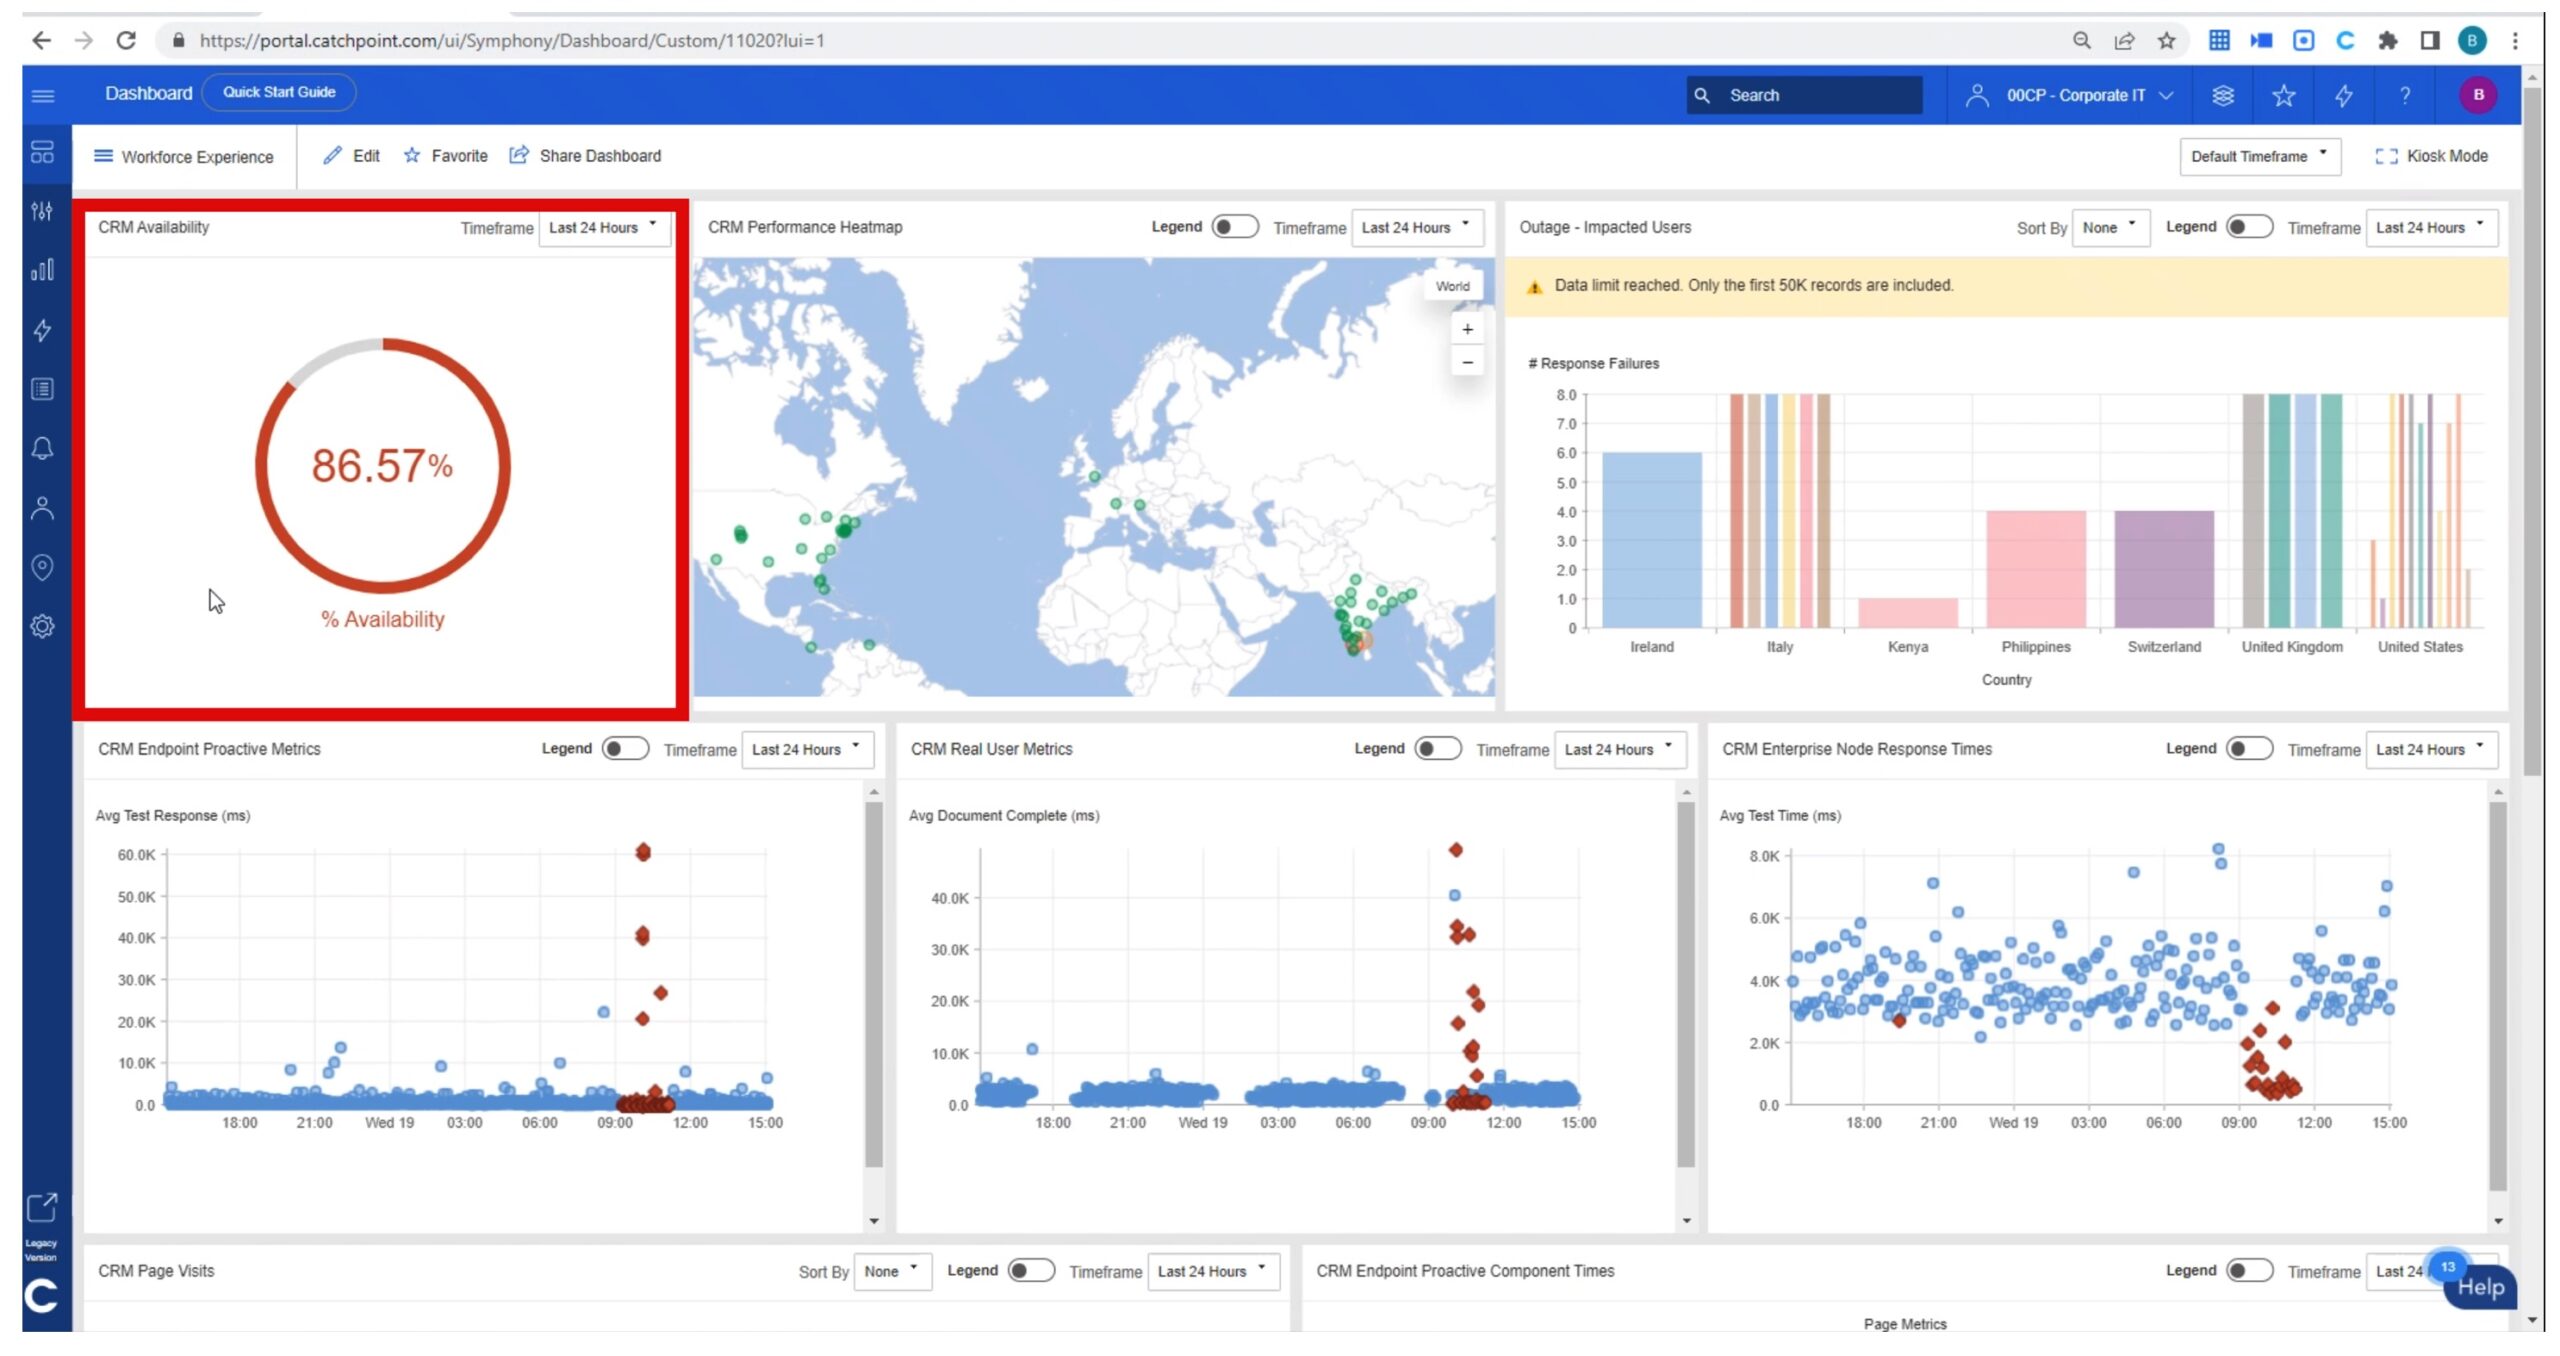
Catchpoint measures the availability of applications from different vantage points. It provides insight directly on the backbone of Internet from Data Centers and ISPs all over the Globe. Many times SaaS applications are available from the vendor’s perspective but users are still unable to access them. This gauge represents the reachability to actual end user devices regardless of their location.
Looking at the two bottom left tiles (see below for close-ups), red is bad, as usual: higher page load times and page load failures.
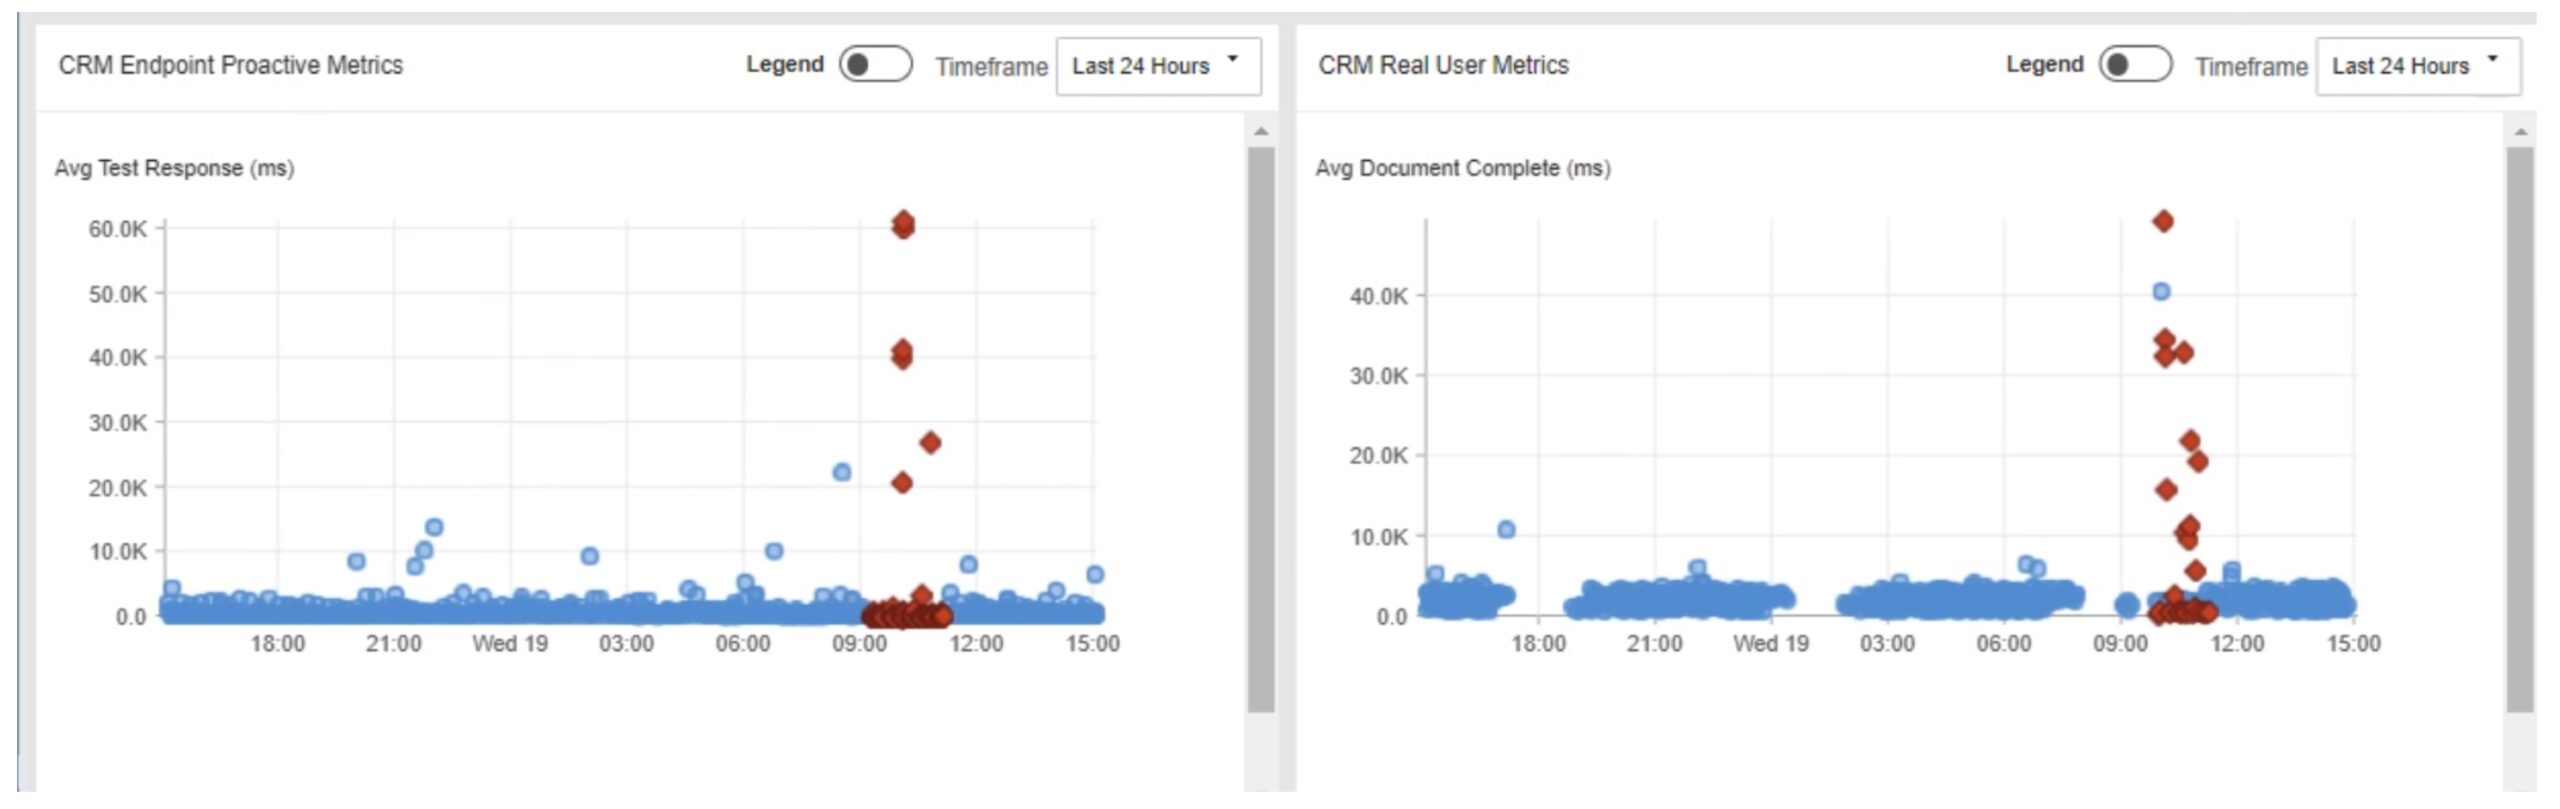
The bottom left tile shows synthetic monitoring from the end user device, the next tile to the right shows actual real user experience as rendered in the browser. If you home in on the time (x-axis), the left tile shows problem onset before the middle one: apparently there were no real users of the app at 9 AM.
Then there’s the right bottom tile:
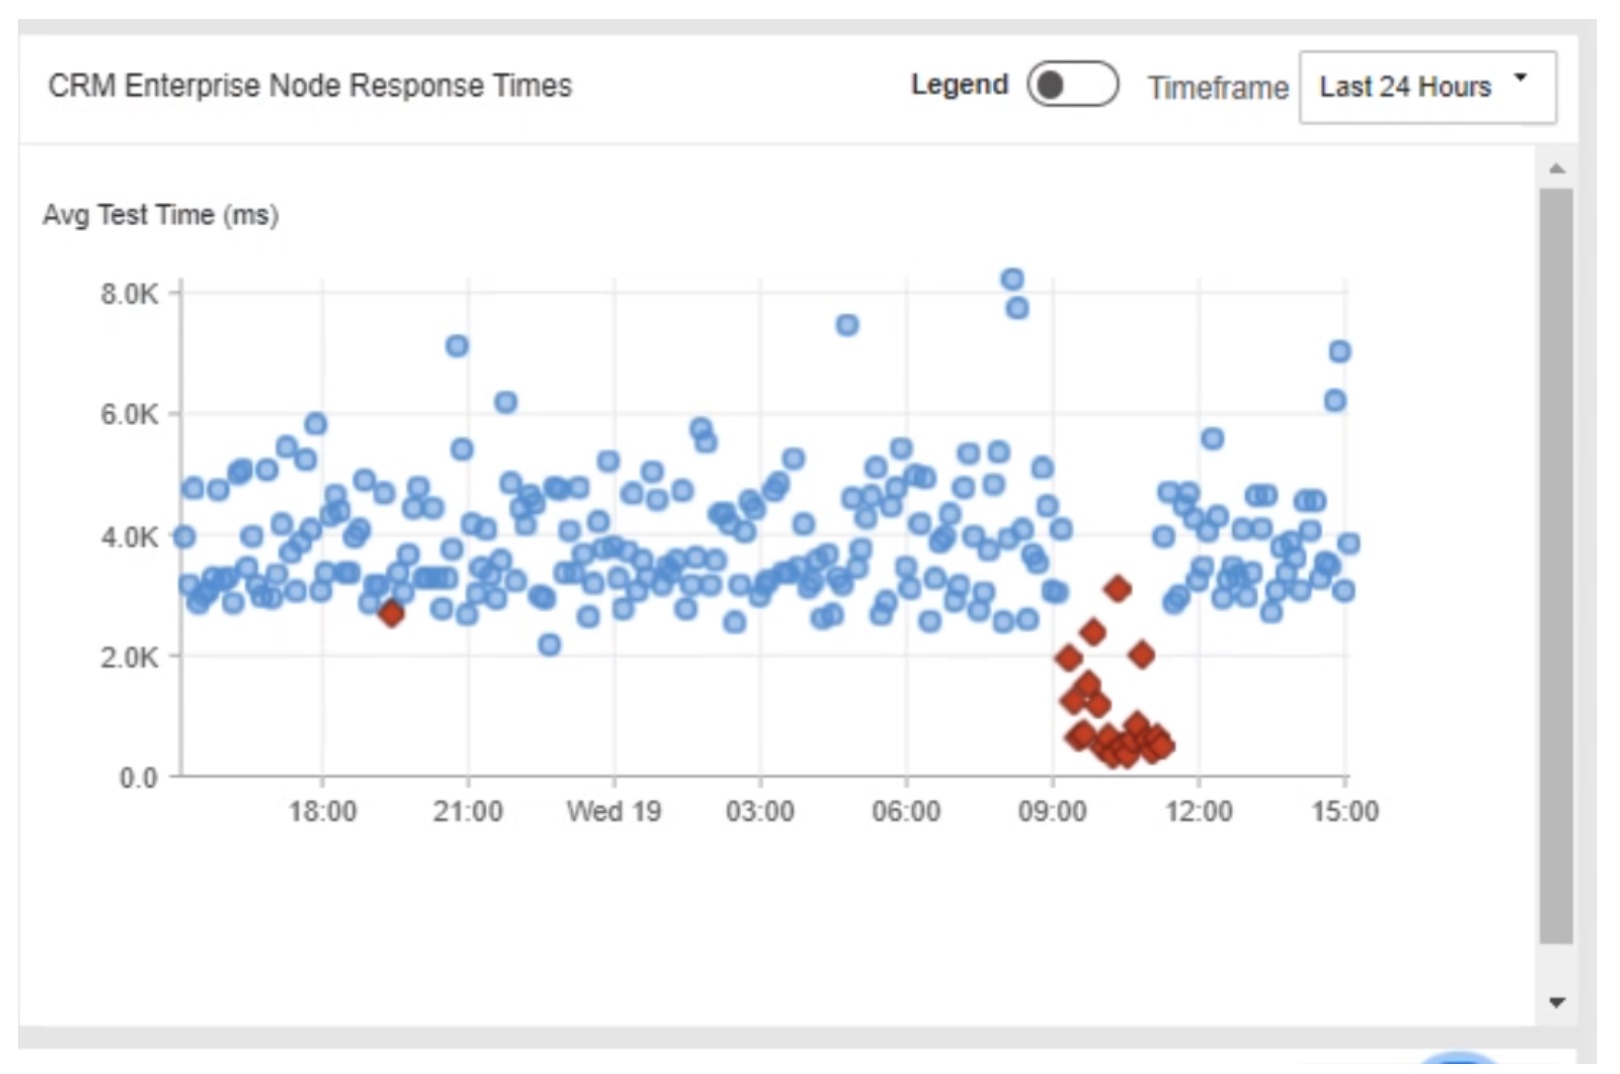
The bottom right tile shows synthetic testing response times as measured from the Enterprise Nodes. These would be agents on nodes in the organization’s network, but dedicated machines with no user workload. They can do browser emulation.
So why are the red datapoints on the right lower? Answer: failure is faster. Those web page loads failed to complete and timed out.
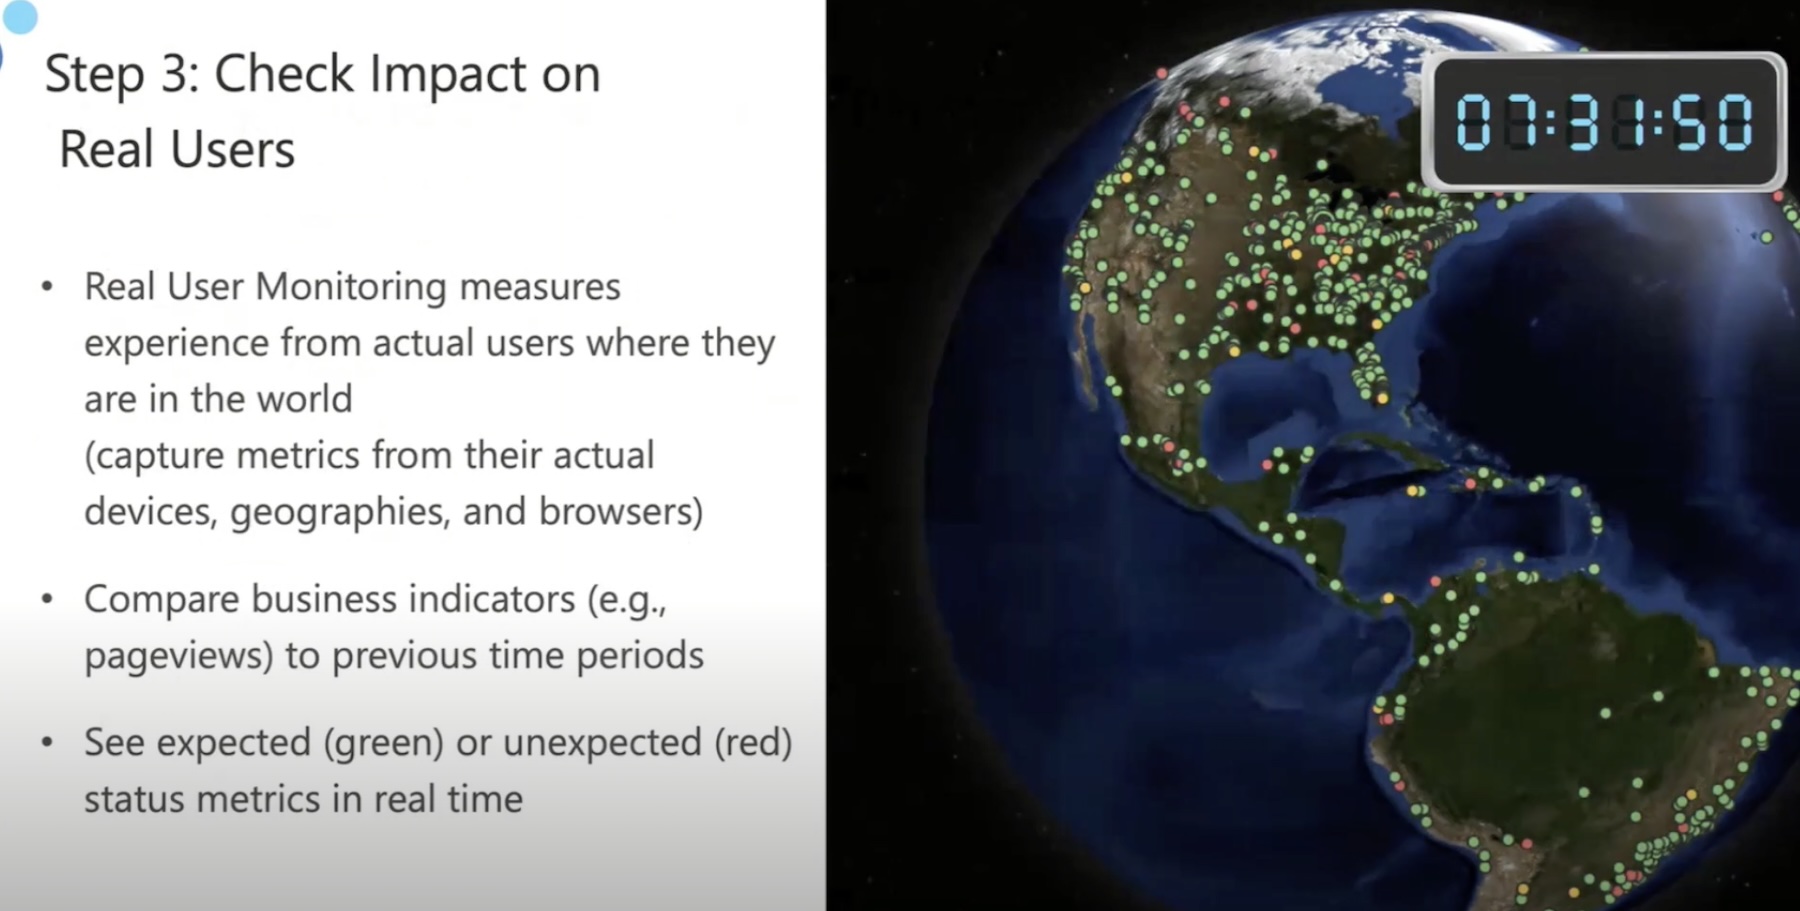
The upper world chart tile shows real user performance, color-coded.
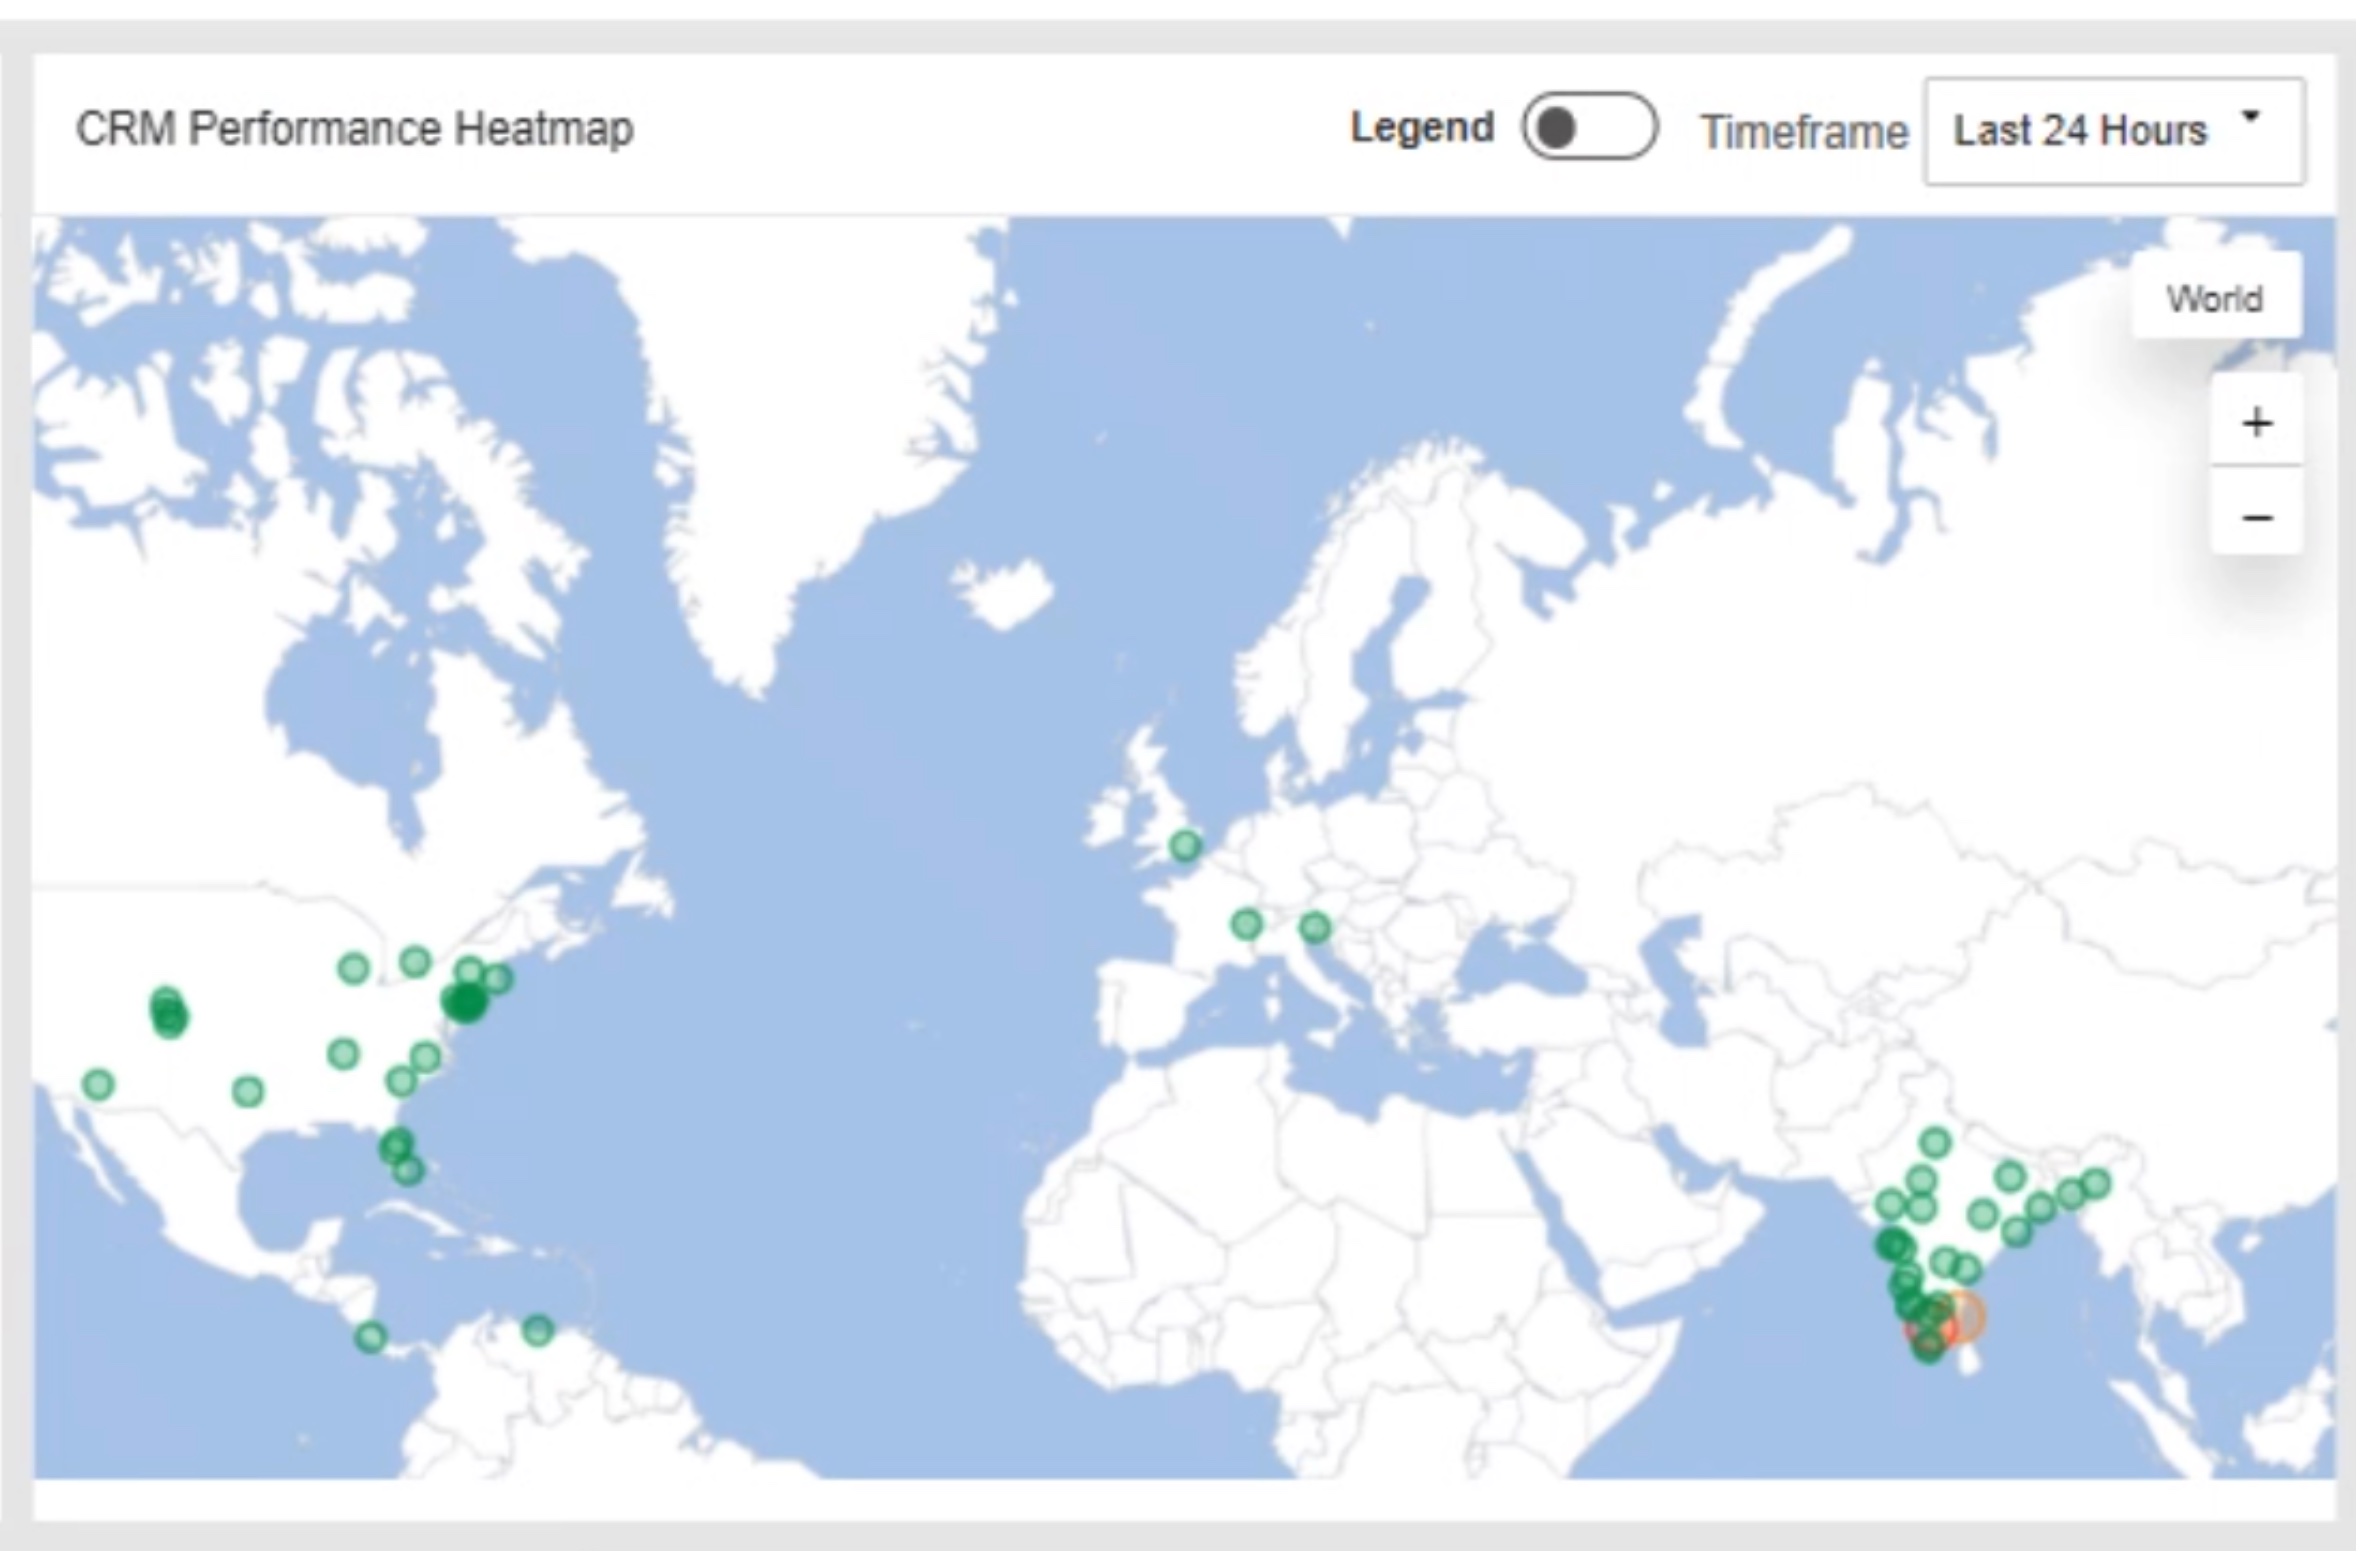
This helps you quickly see where affected real users are.
Hovering over a data point, brings up some additional data. (Not shown here.)
But there’s even more data readily available!
Clicking on a data point and then on the 3rd icon on the left side bar brings up a different set of information, shown below.
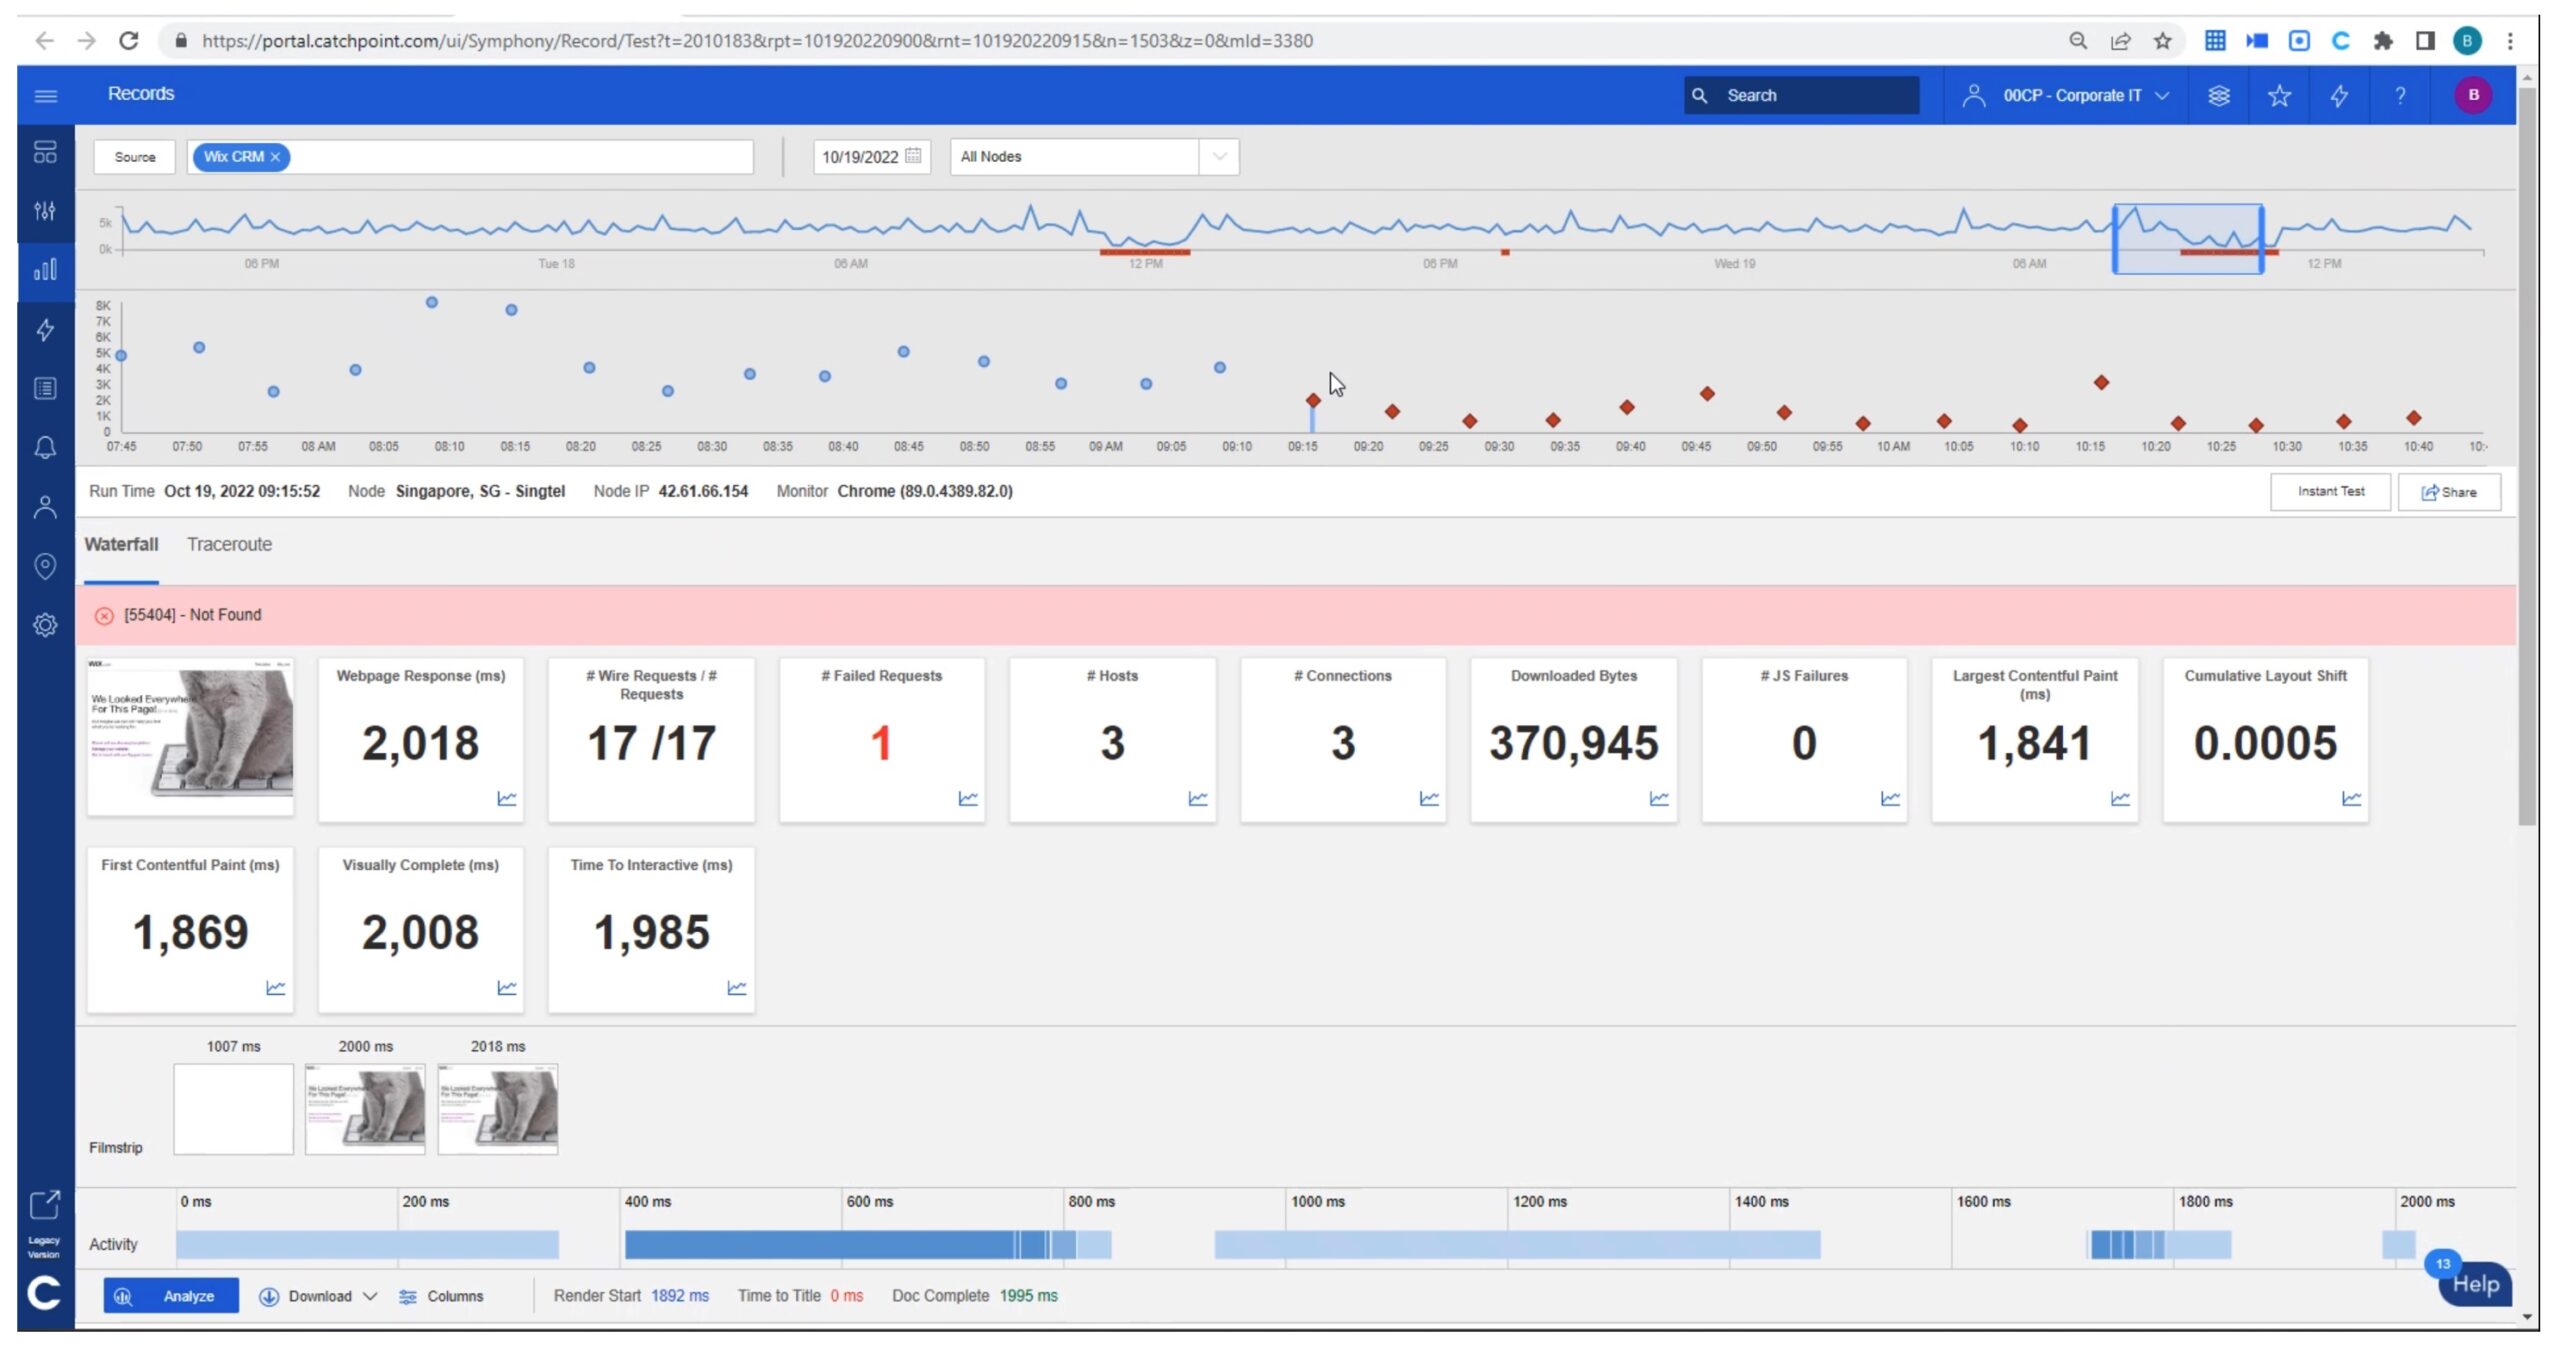
The top shows a timeline of measurements. Selecting one shows further data below the timeline: What the web page looked like, and various statistics. The bottom “filmstrip” shows what the web page looked like at various times as it rendered. This can help you see where things slowed down or failed.
If you look again at the top set of data points over time, notice that some successful page loads were twice as fast as others. This suggests some random delay somewhere.
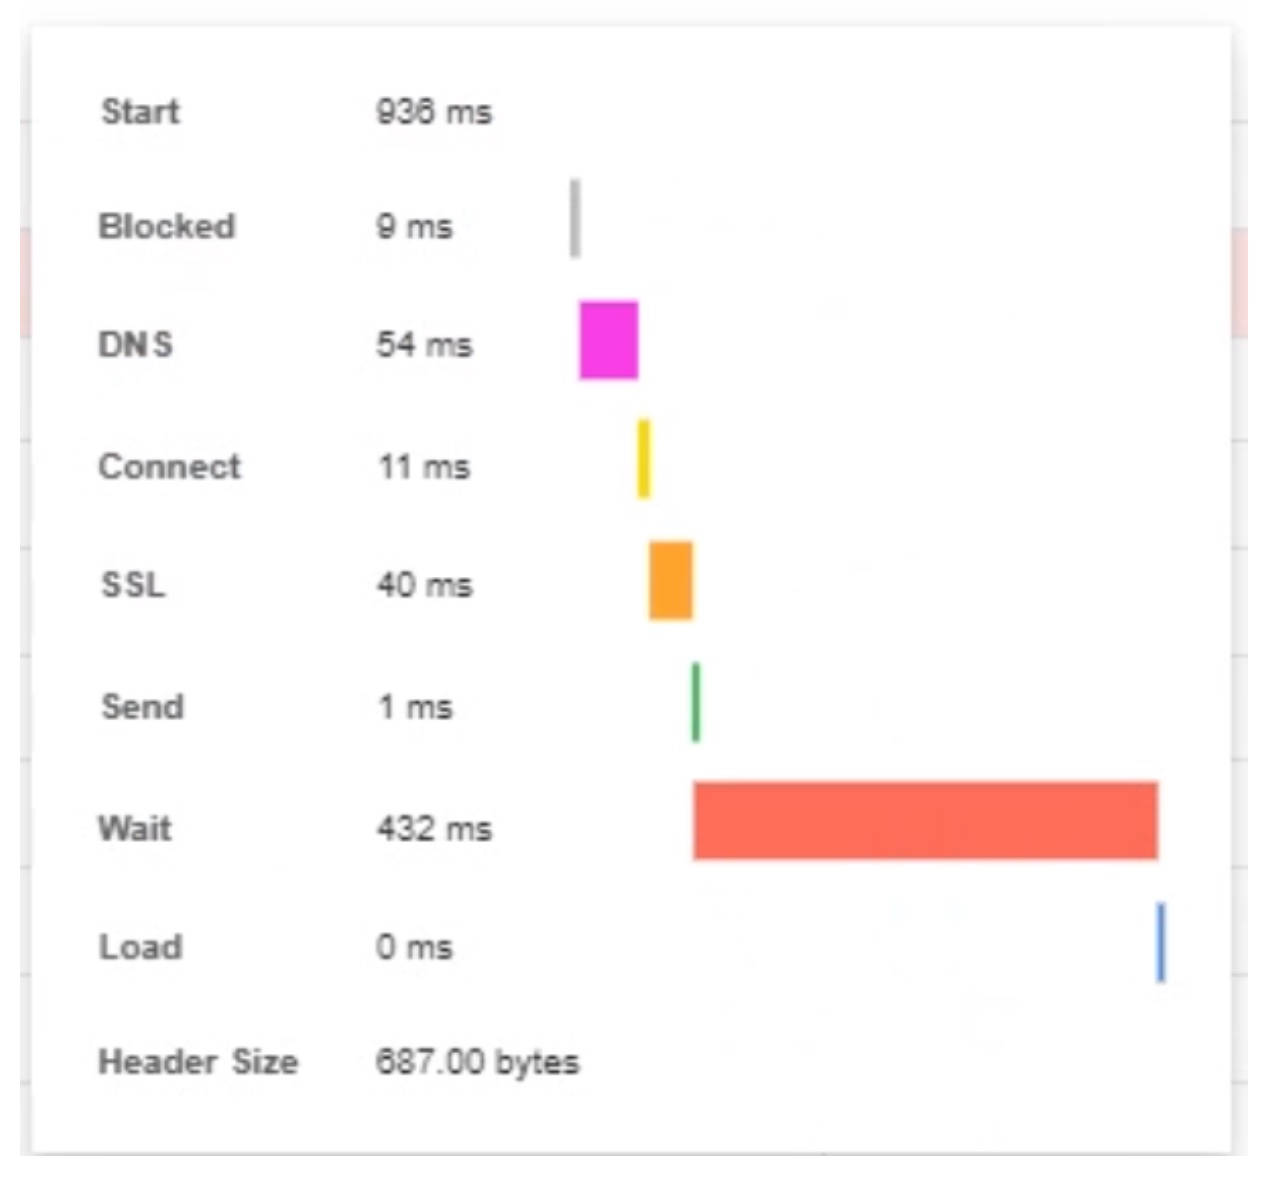
Scrolling down provides more information, a waterfall chart of objects loaded. The highlighted line shows a moderately long wait for that object.
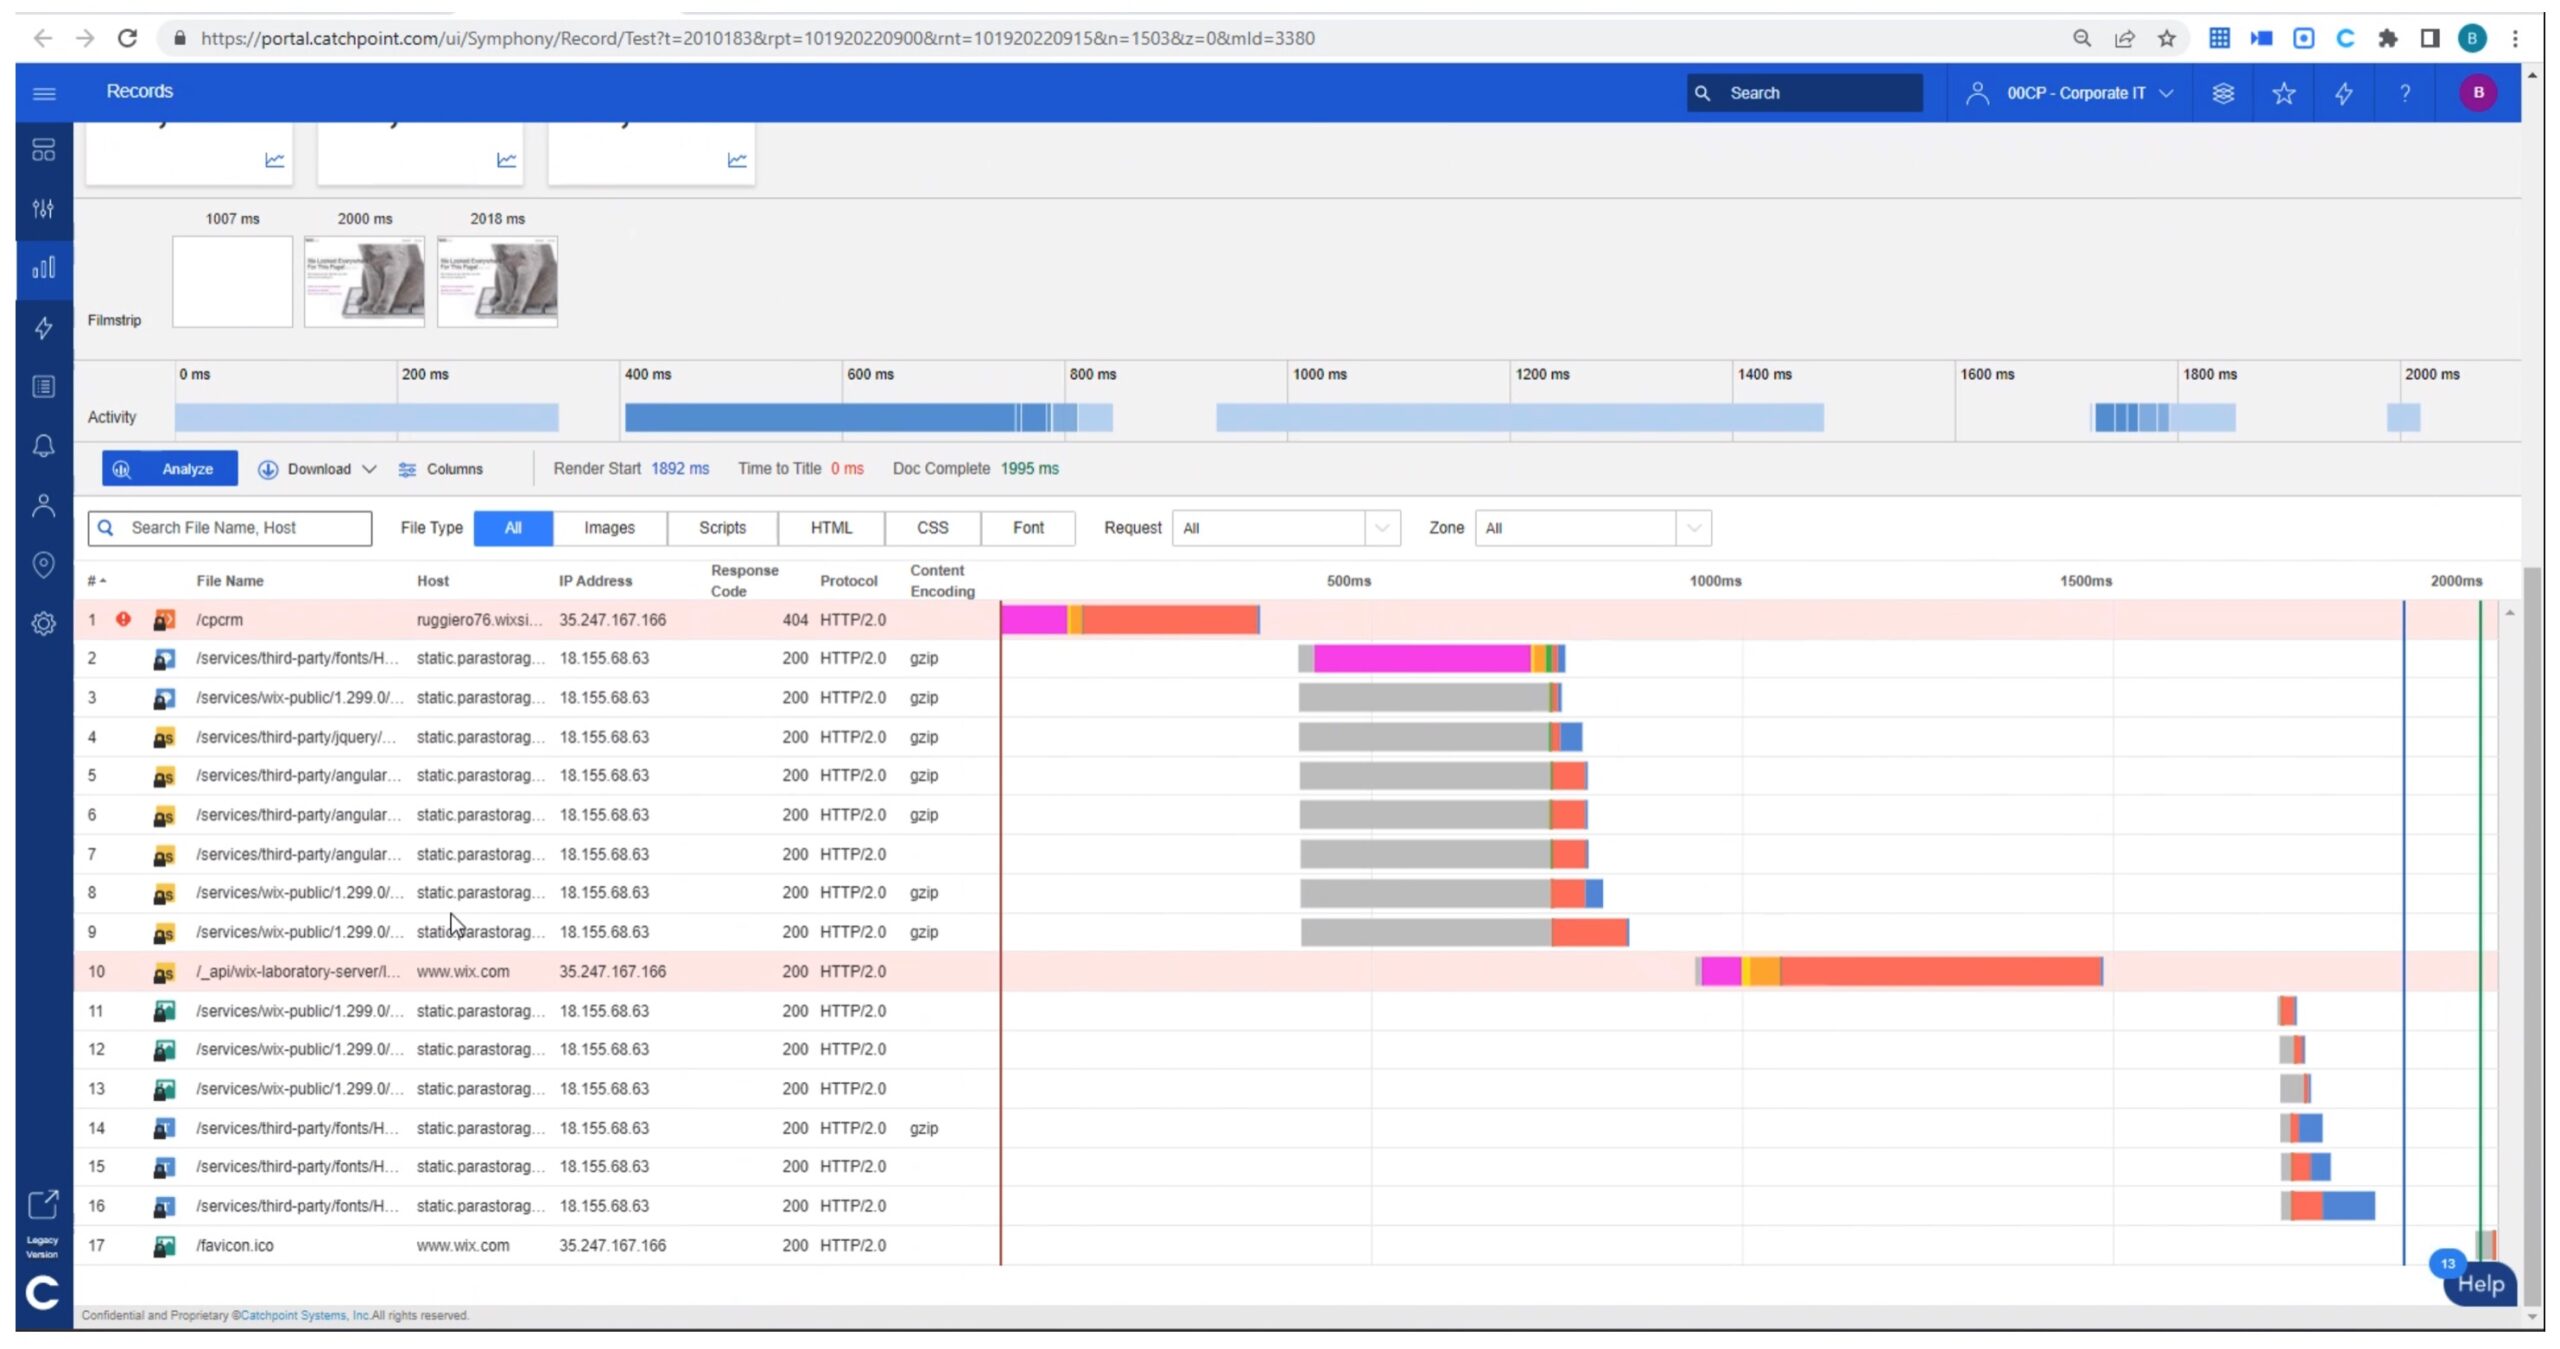
Clicking on that brings up more details:
Scrolling further down, we see:
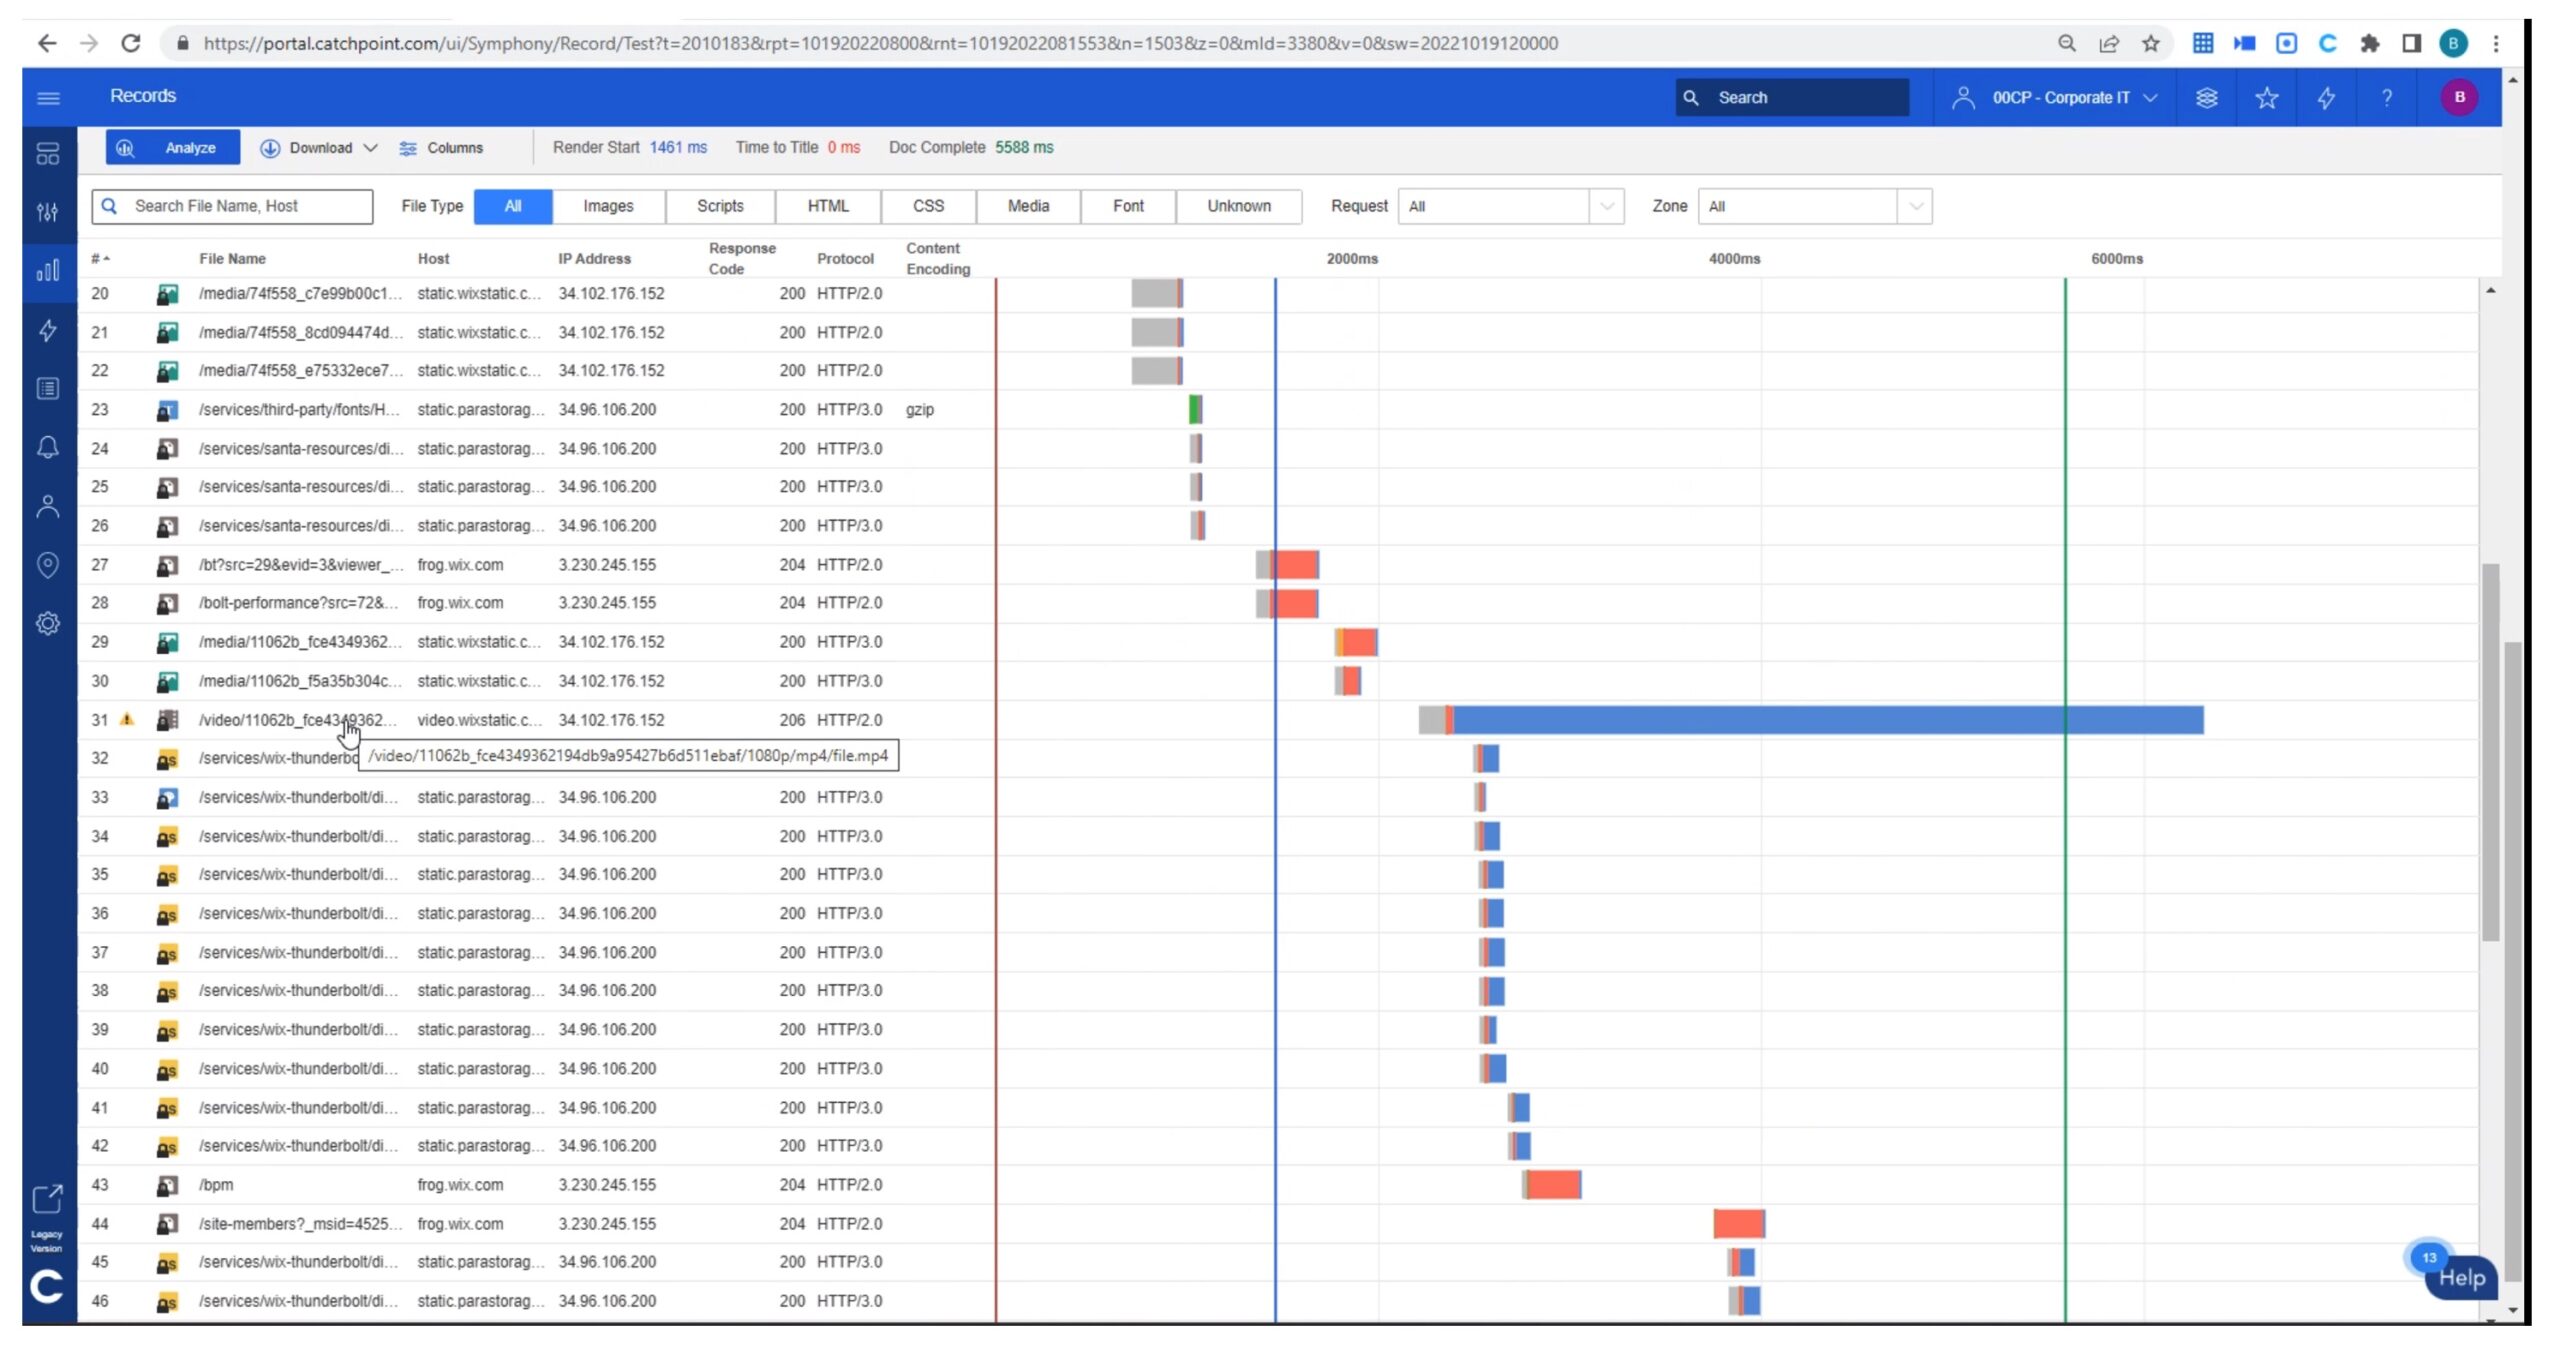
The video in row 32 is taking about 4 seconds to load. Slow!
And that was the actual problem: the web page includes a MP4 video clip. It is larger content and was taking a longer than usual time to download and render.
This provides the basis for an informed decision. You (and any other parties involved) might consider:
- Do you put up with occasional page fails (timeouts) due to the video clip when some sites or regions are experiencing congestion and slowness?
- Or do you remove the video clip, or reduce its resolution to reduce the number of bytes transferred, etc.?
That also gives the flavor of how this might be used in developing or maintaining a web app: use the RUM data to optimize web page load times, etc. Additionally, it allows you to hold SaaS Vendors accountable for content on their sites. Catchpoint RUM data shows how many times a page was loaded over time so quantifying the impact that a slow page has on employee productivity is easy!
If you go back to the original screen and then scroll down, there was more data available there.
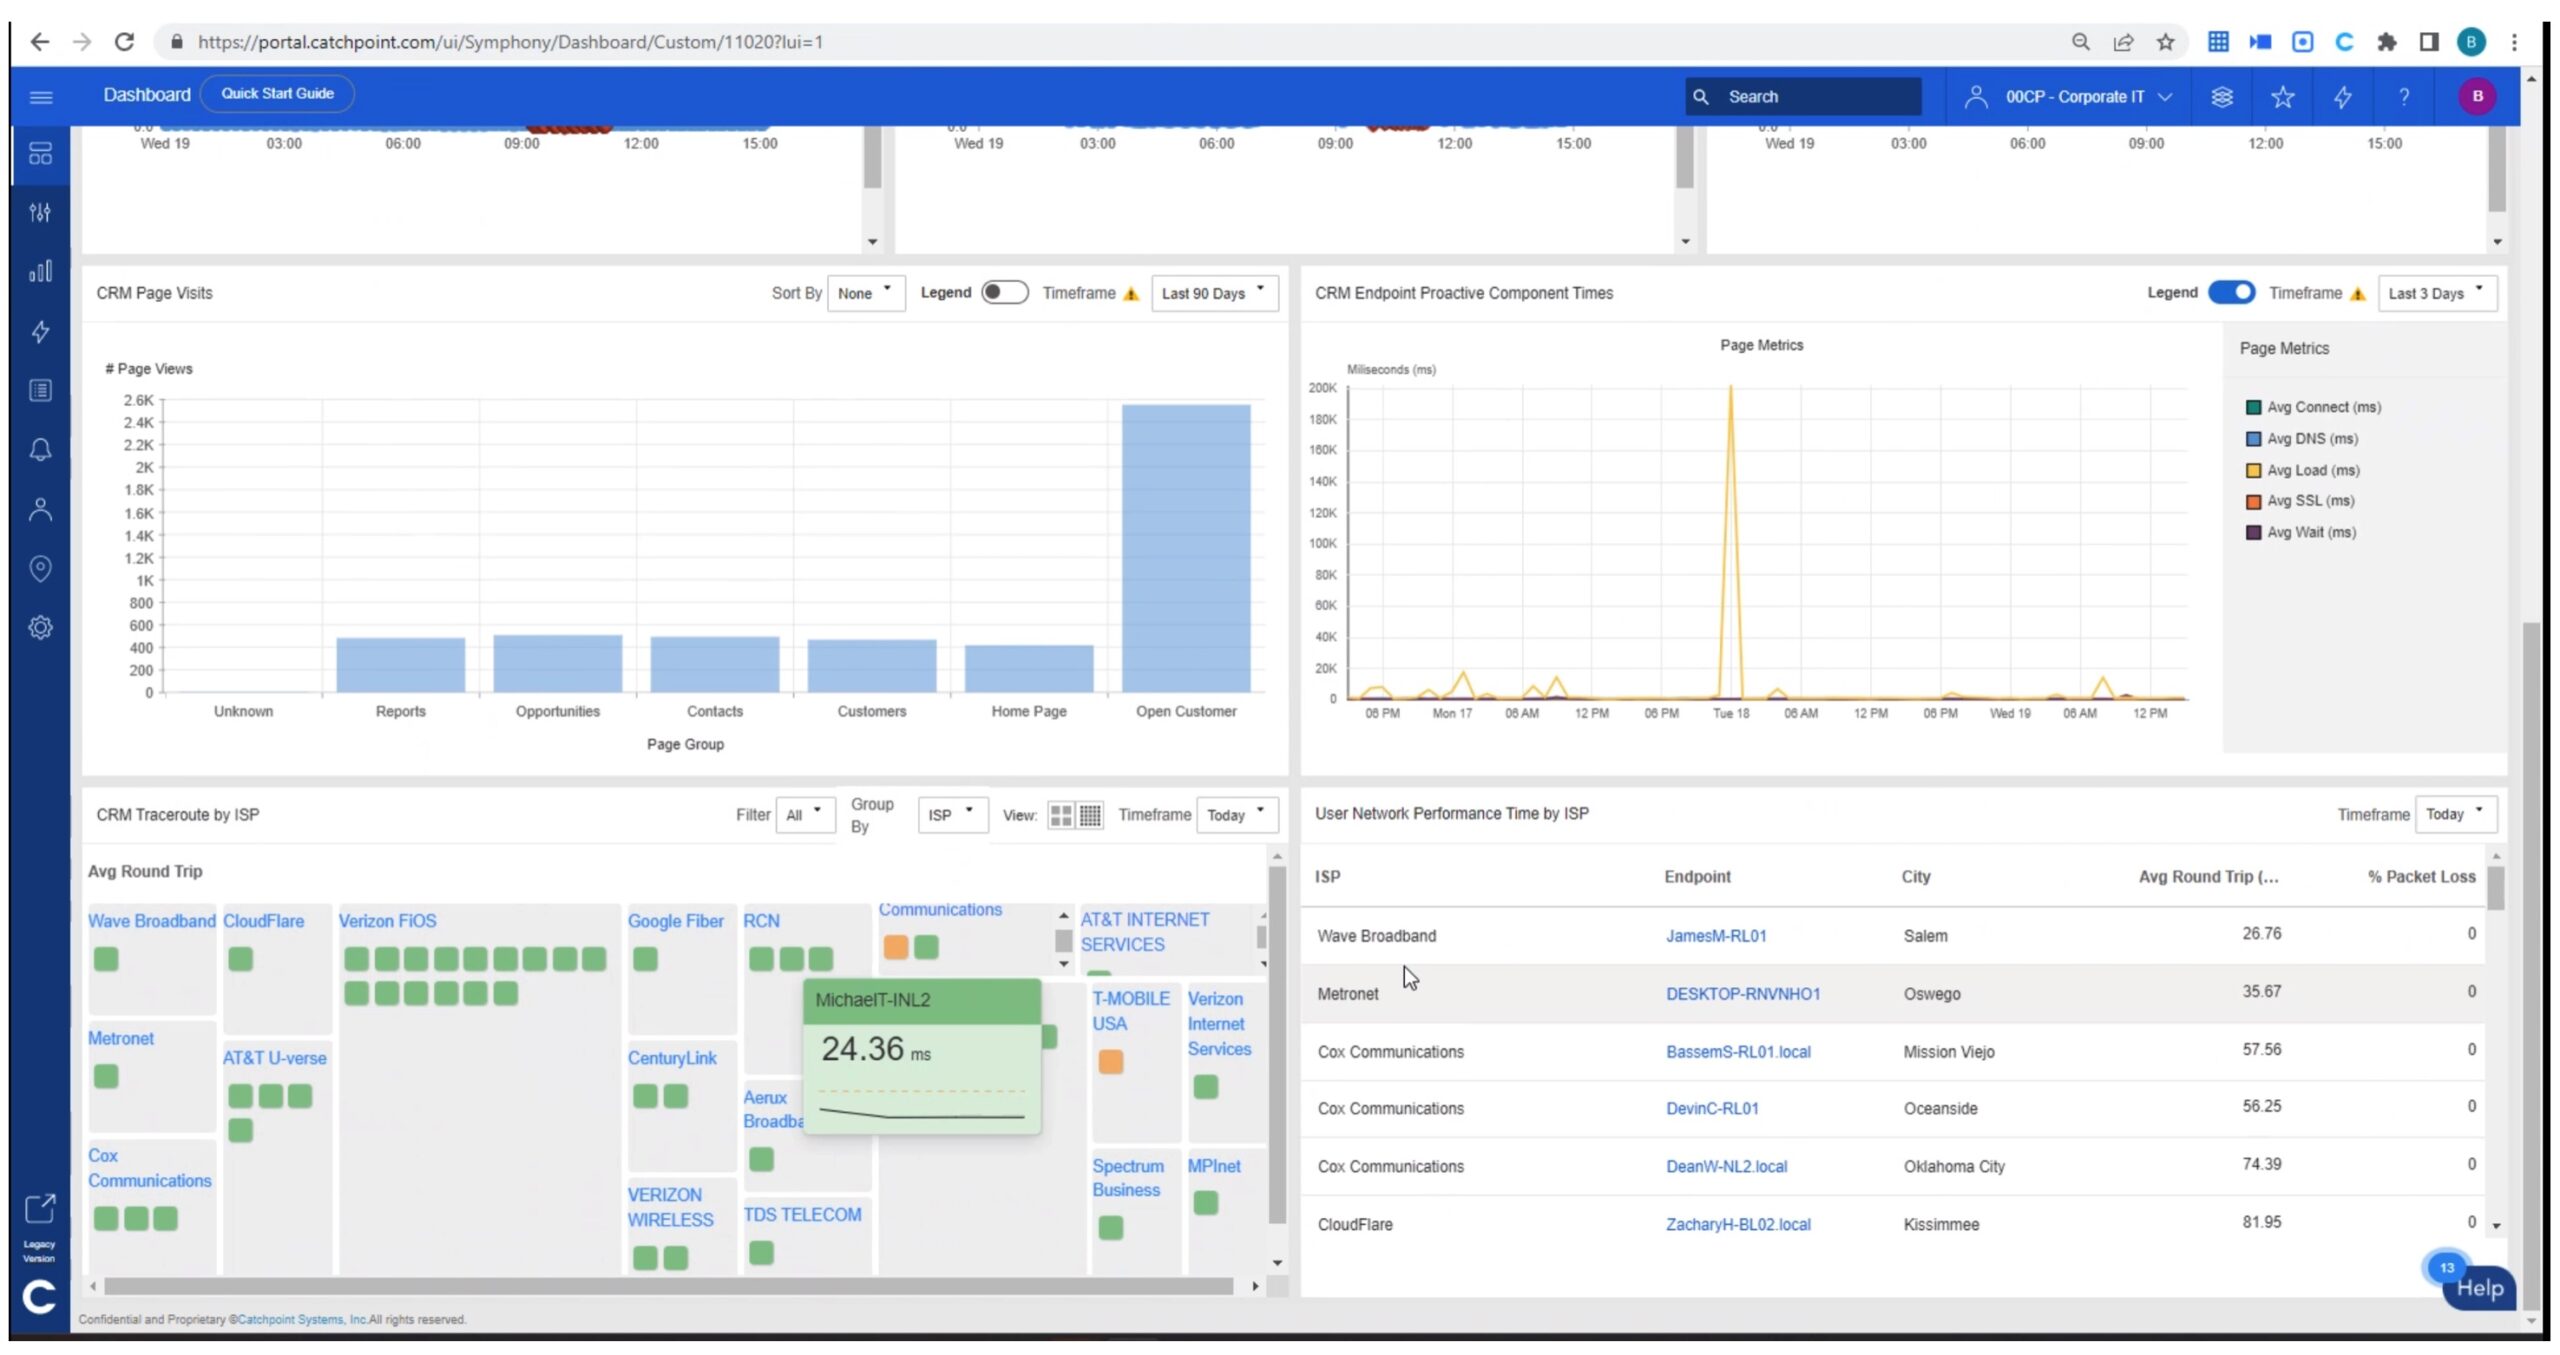
The upper right tile clearly shows a spike in average load times.
The bottom left tile breaks out load times by ISP, with the small squares representing one user. This helps spot where there is an ISP problem. The bottom right tile summarizes the per-ISP data in text form.
Catchpoint’s Day 1 Support
I’m seeing a growing trend in networking and IT awareness that buying software or doing automation can result in “shelfware”. Staff needs to know how to use the new tool and have a good reason to do so.
As part of its process, Catchpoint includes services by a “value engineer” as well as a “customer success engineer”. The value engineer’s job is to understand top use cases and get the customer set up to monitor what is needed and understand the reporting.
Deeper dive and site staffing are also available for a fee.
Conclusion
Catchpoint provides a lot of reporting out of the box. I’ve found myself somewhat overwhelmed by fast presentations (e.g., at Network Field Day). Catchpoint staff walking me through the above use case helped, and I’ve tried to share that in this article.
My hope is that sharing that experience with you, the reader, will help you envision how Catchpoint might be useful for monitoring your Internet stack as well as other applications, re-engineering them to be more tolerant of slowdowns, and respond to outages more rapidly through well-organized pre-analyzed data. Catchpoint makes your Internet more resilient which requires more than traditional application or network performance monitoring. The breadth and depth of monitoring capabilities shown to me suggest that they can do just that.
Watch all of Catchpoint’s videos and demos from Networking Field Day 29 on the Tech Field Day website.