Whether you run a large fleet of servers for your organization or host applications in the cloud, hardware telemetry can help you do your job better. By collecting and analyzing metrics on CPU performance, memory, fans, and other elements, you can anticipate failures before they happen, optimize workloads, and enjoy more reliable and high-performing infrastructure.
That’s why Intel exposes reams of telemetry on critical components in every processor. Infrastructure operators want this telemetry for a couple of reasons. One, it helps them optimize resources to better serve customers, whether internal to the business or as a provider. Two, telemetry is the key to smart troubleshooting, predictive analytics, and autonomous operation.
Inside Intel
Intel exposes operating conditions and performance information on key components of its processors, including the CPU, memory and DIMMs, fans, and other elements. It supports a variety of methods to get this telemetry, including a tool from Intel called the Intel Telemetry Collector. You can also collect telemetry using the Perf function in Linux, Google’s cAdvisor, or collectd.

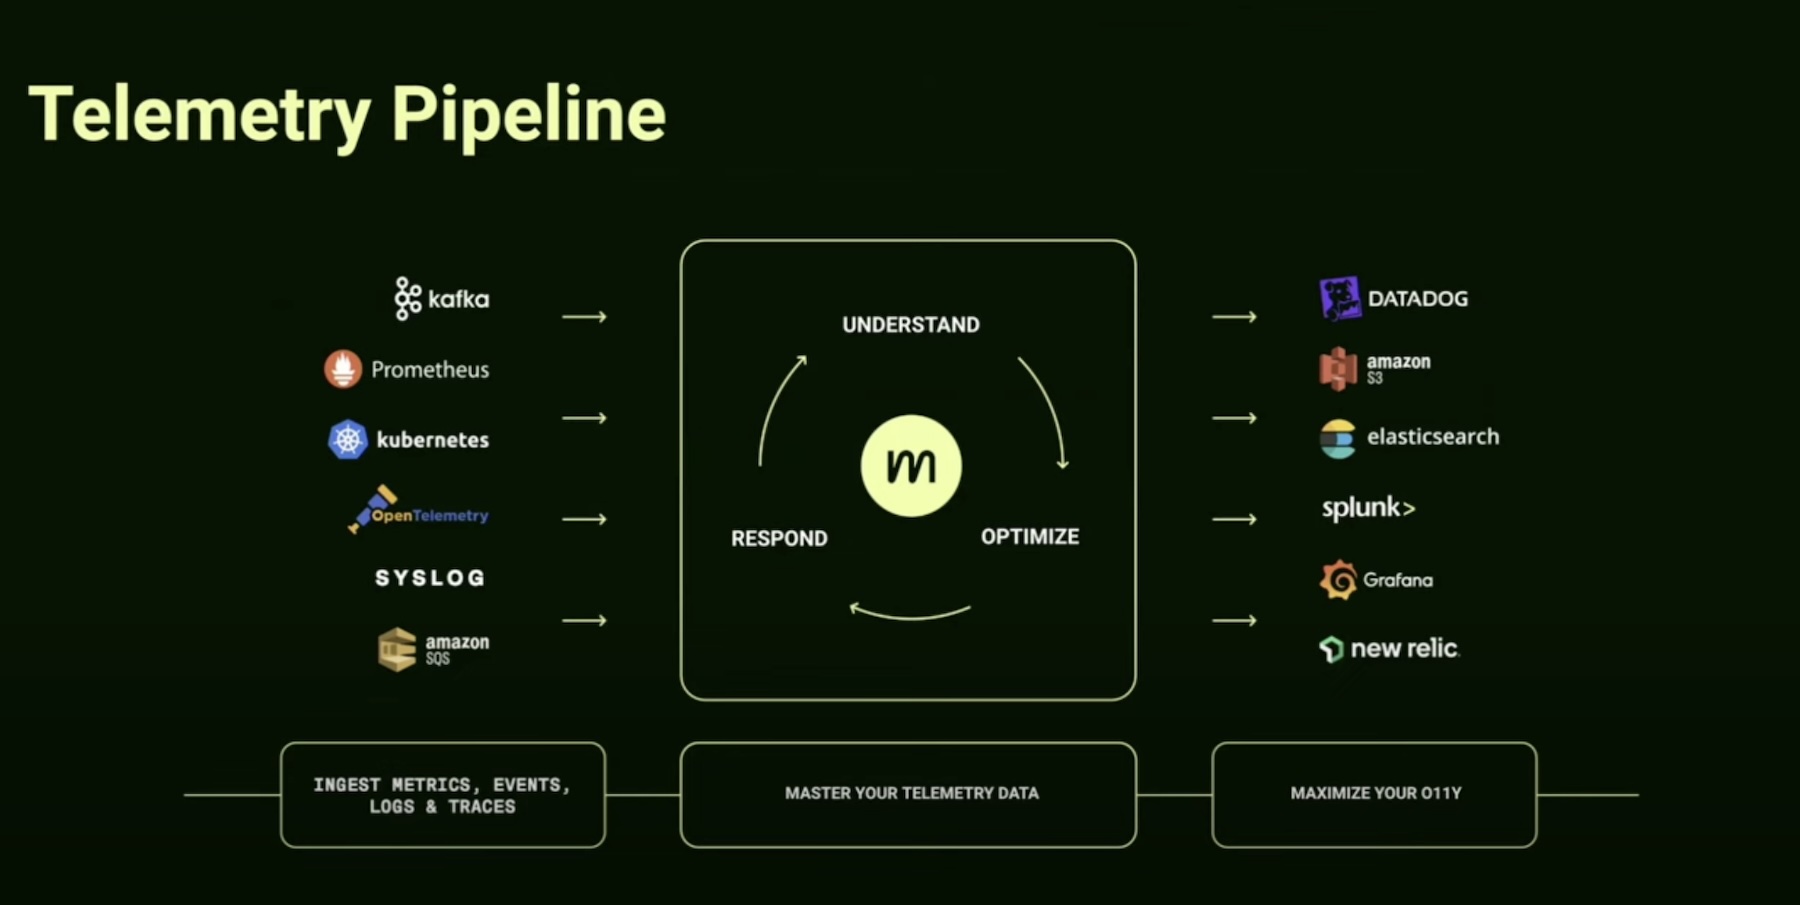
Telemetry is pulled from nodes every 24 hours. The data can then be surfaced up to operators through several visualization tools, including popular options such as Prometheus, Grafana, and the ELK stack (Elasticsearch, Logstash, and Kibana).
You can collect this telemetry from servers you operate yourself, of course. But telemetry is also available from public cloud providers, though availability may depend on the instance type you use.
The Four Pillars Of Telemetry
The benefits of Intel hardware telemetry fall into four categories: efficiency, reliability, performance, and security.
Efficiency
There are a variety of costs that come with running a large fleet of servers, including energy costs for power and cooling, management costs, and the capital expense of purchasing equipment. By tracking metrics such as CPU and memory consumption, organizations can help control these costs while also maximizing the productivity of each machine.
With Intel’s telemetry, operators can identify underutilized servers and shift workloads to those machines. Not only does this help balance performance, but it may also reduce the need to buy and deploy new hardware or spin up new cloud instances.
Reliability
Servers are complex systems assembled from a mix of solid-state and mechanical components. Intel combines device telemetry with machine learning to help infrastructure operators anticipate – and then address – component failures, which leads to more reliable operations.
For example, Intel can measure the RPMs of server fans and compare them to failure models. If a fan’s RPMs fall within this failure prediction model, it can alert an operator. The operator can then move workloads to other machines, take the server out of commission, and make the repair. This is a much more graceful process than an emergency response to a server that overheats and drops dead because of an undetected fan failure.
Intel also gathers metrics on essential components such as memory. Memory failure is a top complaint for data center operators. Intel tackles this problem with the Error Detection and Correction (EDAC) driver, which looks for correctable errors at the DIMM level. By applying machine learning to look for error patterns, Intel can then reliably predict failures. This information is surfaced up to operators via a health score so that operators can take appropriate steps – before a memory failure occurs – to remediate the problem.
Performance
Intel builds Performance Monitoring Units (PMUs) into its processors. This hardware collects parameters such as cycles per instruction, cache hits, and cache misses to measure how processor resources are being used by an application.
If an application is slow or not meeting performance expectations, the output from PMUs can be collected and shared with infrastructure operators and developers to understand how the application code can be optimized to take full advantage of the processor’s microarchitecture. This can be particularly useful for folks who want to get more performance from cloud nodes without having to bump up to a larger and more expensive instance size.
Security
By leveraging the PMU, Intel can examine the run-time behavior of programs. In combination with heuristics and machine learning, it can then identify potentially malicious behavior. If a threat is detected, Intel can alert an operator or trigger third-party security and remediation software.
Telemetry Is Key To The Autonomous Data Center
By collecting extensive telemetry and using machine learning to recognize patterns and surface up the right information at the right time, Intel is helping move the industry closer to autonomous operations.
In the meantime, telemetry and analytics can help infrastructure and developer teams identify issues before they become outages, troubleshoot faster and more effectively, increase reliability, and optimize code to improve performance and manage costs.
To learn more about Intel’s telemetry capabilities, check out A Path to Intelligent Cloud and Data Center with Intel Telemetry.


