Podcast: Play in new window | Download ()
Subscribe: Apple Podcasts | Spotify | Amazon Music | RSS | More
All of us “Virtualization Admins” are always looking for more information about the performance of our environment. As VMware ESX products have progressed, more and more performance metrics have been gathered and presented to us… and we appreciate it oh so much.
However, one of the largest issues we need to contend with is tracking of this information longer term and being able to correlate the collected information to new issues and/or diagnose future capacity issues in the future.
Previously, we needed to invest in 3rd party company products to provide this functionality. In some cases, the information was difficult to gather correctly, provided very static alerting thresholds, and was not able to integrate well into existing virtual infrastructure.
Back on August 31, 2010, VMware announced the acquisition of Integrien… an up and coming product providing real time performance analytics for all kinds of environments… including virtual environments. Acquisitions are always so curious because we, the consumers, are always trying to figure out how it is going to be used to further the product line of the purchasing company. So, while the product from Integrien was interesting, seeing how it would fit into the vSphere realm as a VMware product was up in the air.
All of those questions are answered today, as VMware has announced the availability of the vCenter Operations products. vCenter Operations is being provided in three flavors:
-
Standard
-
Handles vSphere environments.
-
Deployed as a virtual appliance that hooks into vCenter and is visible as a vSphere Client Plugin
-
Handles up to 500 VMs
-
-
Advanced
-
Same as Standard edition
-
Includes additional Capacity Planning (aka — Standard Edition bundled with CapacityIQ)
-
-
Enterprise
-
This is a whole new beast and includes the ability to monitor much more infrastructure than just virtual hosts and servers.
-
The product information from VMware will list off all sorts of neat features, functions, and purpose for their product. However, after being able to use the product during the pre-release period, I find that the following are the main value points for my environment:
1) 10,000’ view of Virtual Environment
All kinds of monitoring solutions exist that claim to be the single pane of glass that should be able to solve all of your problems. However, it appears as though this is the first to actually accomplish that.
Check out what I see:
Just from a glance, I can see that my environment is running well. The overview page uses the typical Green/Yellow/Red color scheme to indicate state. From this view, I can immediately see that my vCenter, Datacenters, Clusters, and ESX hosts are running within established parameters. I see there may be some problems with a handful of VMs. Instantly, I can see what is going on.
Without going into a complete demo, I can click on any object in the page and get relationship information (aka — which vCenter, which Datacenter, which Cluster, which ESX, and which VMs).
2) Defining what is normal for your environment
Determining what is normal is one of the most important aspects of what the vCenter Operations Standard product offers. What is normal to me is not normal for everyone else… we are all special in our own way and vCenter Operations Standard understands that.
When vCenter Operations Standard is installed and configured, you do not need to do much of anything. The installation guide is dead simple. Why is this?! Well, because vCenter Operations Standard learns about the behavior of your environment.
Rather than rely upon static definitions that would cause warning and critical alerts (example: Warn when RAM = 80%+ and Critical when RAM = 95%+), vCenter Operations watches what happens in your environment from day 1 and starts to determine what is normal for you. If you configure your applications to utilize almost all of the RAM assigned, the other solutions may alert you to a critical state. However, this is normal and expected. You would never expect to see an alert for when the server RAM utilization drops to 10%. However, by using dynamic thresholds in the learning and monitoring algorithms, vCenter Operations Standard is able to determine that high RAM usage is normal and alert you to when the situation is NOT normal… so, when the server drops to 10% RAM usage, you will get alerted because it is abnormal.
vCenter Operations relies on some crazy algorithms and analysis that any PhD in Rocket Science would love. Various algorithms exist in the environment that chew on the data as it is received. The results of the algorithms are selected based on most likely to be correct and used to represent the data in some fashion. So, there is a higher probability of the data and situation being statistically correct.
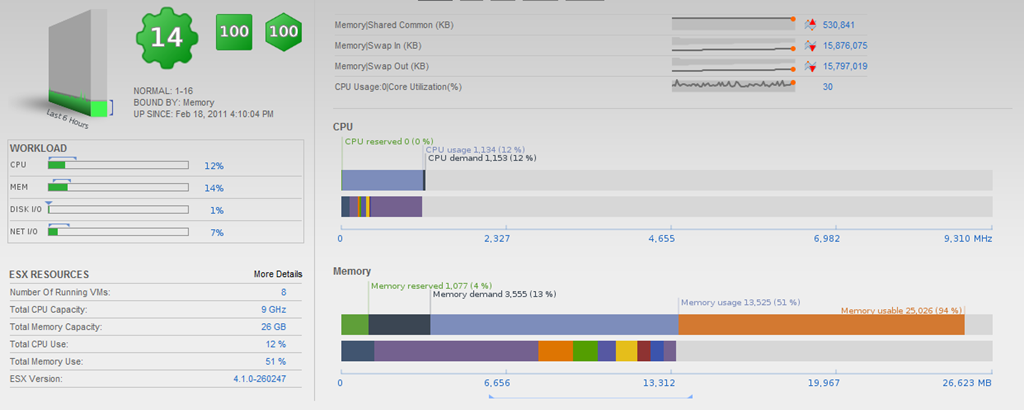
Check out what I see:
This is a view of a specific ESX host in my environment. You can see that normal is somewhere between 1-16 and is typically defined by the Memory usage. Additionally, you can see various statistics regarding the current workload, CPU, Memory, and ESX resources. Again, all from a single screen.
Now, compare that to a different ESX host that is hit a little harder:
Normal for this server is somewhere between 61-100 and is defined by the Memory usage.
3) Resource statistic aggregation to provide a more holistic view of what my environment is like on a historical basis.
This little nugget of joy made my day the first time I saw it.
vCenter Operations Standard is able to aggregate many statistics into a single value for you to see that represents your resource in the environment. So, rather than use resxtop to find NIC statistics in my environment, I can get those statistics from vCenter Operations Standard in a easy to read way.
For example: There have been many times where I wanted to get a good idea of how much data is passing through my NICs. Previously, I would need to get some batch data from resxtop, throw it into a spreadsheet, and process it. Or rely on some historical data from vCenter. Now, I can dig into the ESX host in vCenter Operations Standard and select the “ESX USED NETWORK INTERFACES” section at the bottom of the page.
Clicking on one of the number shows me even more information. This is the graph for Received Rate (KBps):
How cool is that?!
Similar statistics can be gathered for CPU, Memory, and Storage as well!
4) Analytics and Fires
Analytics are presented as hot zones and sized based on relationship to others. So, just looking at the graphic, you can get a sense of the relationship between other objects. I know, that is a little obscure. But, check this out:
From here, you can see that there is a fair amount of contention for the Exchange partition compared to that of the other datastores in the environment.
Having access to this data is still new to me and I am continually finding more and more ways to interpret it.
The vCenter Operations Standard product provides amazing insight into the your virtual environment. Whomever at VMware decided that Integrien was a suitable acquisition should get a high-five for this one.
No doubt, this is an insanely useful product and is definitely raising the bar in what is possible in the analytical world. I look forward to seeing this product grow and mature.


