Who is always to blame when applications aren’t working correctly? Is it the function calls in the app? Maybe it’s a dying hard drive on the server that runs the app database? Could even be a memory leak in one of the servers? Well, these are all possibilities. What usually happens is that a ticket is filed with the IT support team claiming “the network is slow”. The network is almost always the root of the problem, at least according to users.
Network admins spend more time defending the network than they do fixing it. They spend all their time chasing down phantom issues that crop up or are transient and caused by other underlying problems. It’s like chasing ghosts through a network in the hopes of finding out if your application cluster is haunted or just being mismanaged by Old Man Dithers that used to run the abandoned amusement park. You need a tool that can help you get to the real root cause faster.

Visibility Where You Need It
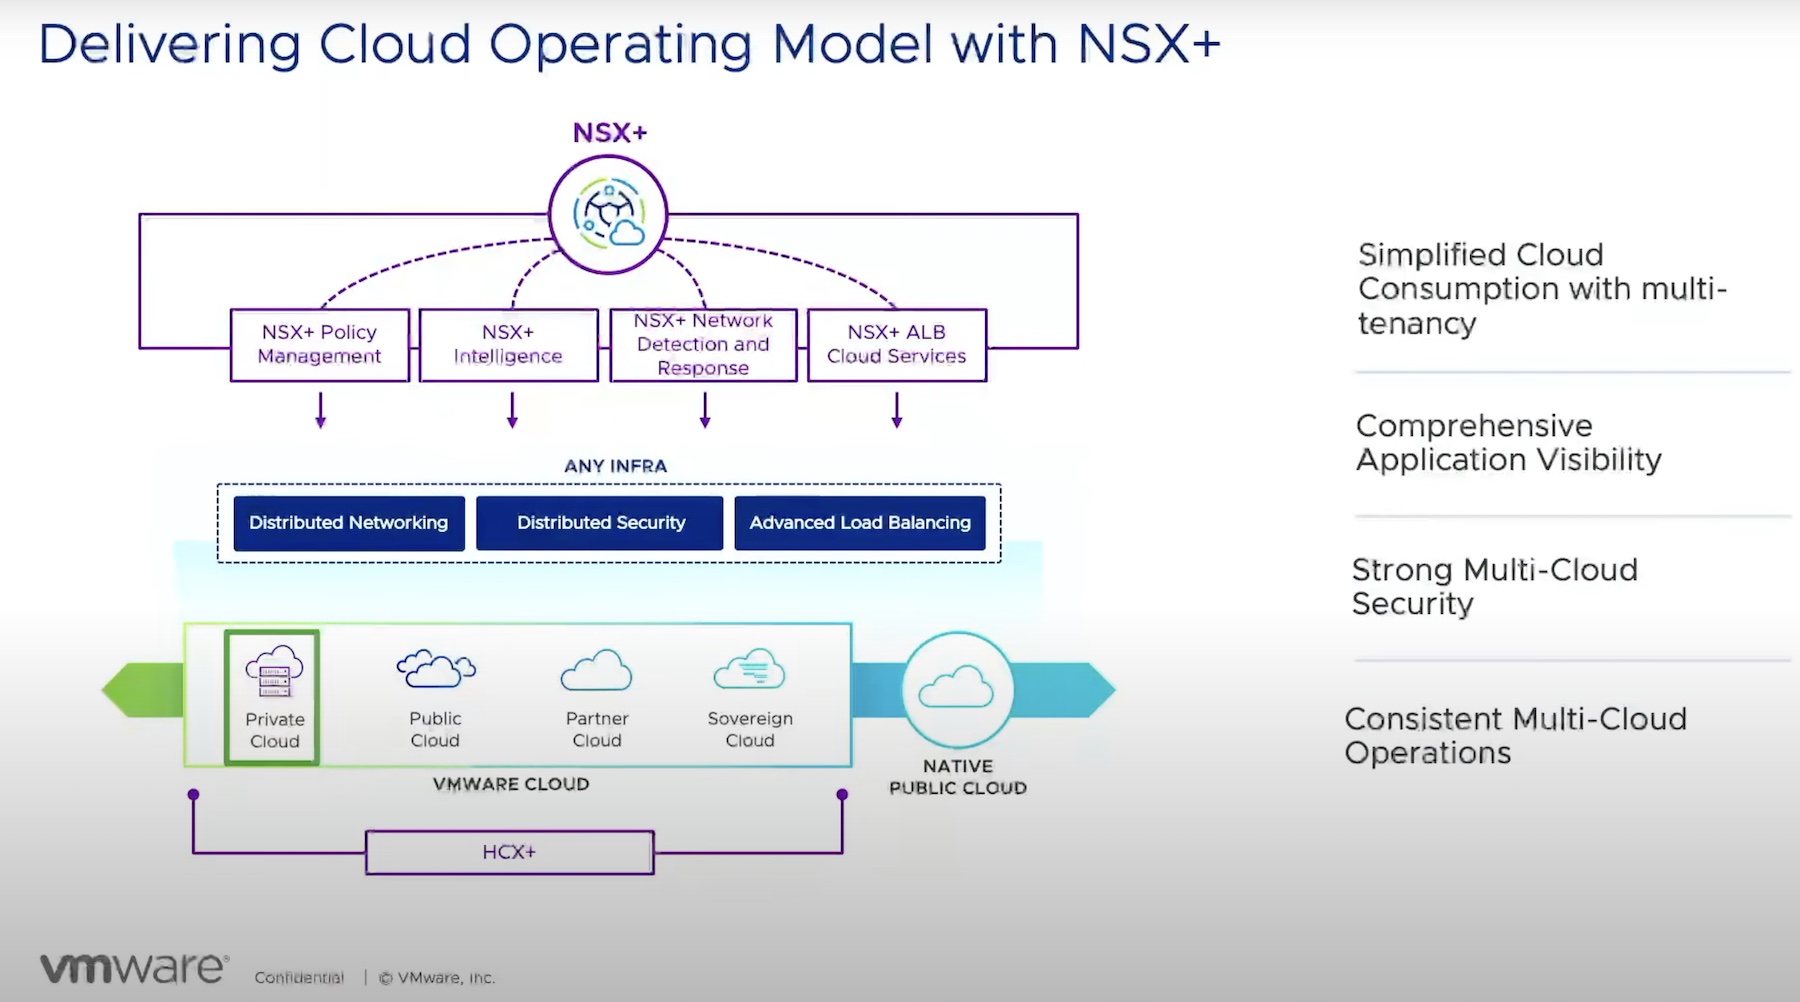
You may have heard of VMware NSX Advanced Load Balancer before. No doubt you have heard of Avi Networks, which is the company that VMware purchased as the basis for the NSX Advanced Load Balancer. Avi was a well-known name in the industry even before the acquisition.
VMware NSX Advanced Load Balancer is the kind of tool that can help you diagnose and discover your networking ghosts before your users start claiming everything is haunted. How does it manage to do that? Check out this demo from Ashish Shah to learn a bit more about how the tool is deployed in a network:
This demo really resonated with me about halfway through. As Ashish explains, VMware NSX Advanced Load Balancer is a full proxy. That means it intercepts the request from the user and initiates a new request to the application. It’s not a passive partner hoping to find evidence of ghosts. Instead, it’s actively looking around to see what the status of everything is. It can measure application latency times. It can measure the response time of pods, servers, or clusters. While that doesn’t sound too terribly exciting at first it has the potential to help you narrow down a wider variety of transient issues.
If the performance in an application is bad all the time, the culprits are generally easy to investigate. It has to be one of a certain subset of problems to be affecting everything equally. These are the problems that network admins love to solve. They’re fairly quick to diagnose and when they’re fixed everything goes back to normal. Users are happy and everyone gets what they want.
But transient issues are harder to track down. Maybe it’s not the entire system that’s performing poorly. Maybe it’s one part of the cluster of servers or one pod out of ten that has an issue. With a properly functioning load balancing platform, you’ll probably only see that issue one time out of ten, right? Or maybe it’s one time out of twenty when the system notes poor performance and shuffles users to a different box. But how can you see that? Do you just rely on users calling you to tell you things are acting “weird” only for them to go away when they close and restart their app? What kind of visibility do you have to figure out when these things pop up from time to time?
In the demo, Ashish shows that VMware NSX Advanced Load Balancer knows about the status of the system at all times. It treats each balanced application like a self-contained unit. It runs health checks and measures latency to servers and pods. You can quickly see when the performance is degraded and take action. But it’s not just when the overall performance is degraded. You can drill down into the system to find where a single member of the cluster is having problems. Maybe it’s not the network latency between the edge of the network and the server. It could be the latency at the server itself. This means you can eliminate the network as the source of the problem and start investigating why the latency in the response of the server is high. Rather than an “all hands on deck” kind of troubleshooting exercise, you can instead find the ghosts in the very specific part of your infrastructure and do something about them when they live.
Bringing It All Together
Between Ghostbusters and Scooby-Doo, I thought being an adult was going to involve a lot more supernatural investigations. What I didn’t realize is that those ghost chasing exercises were going to be more focused on tracking down problems in my network and not the long-departed souls in the movies. It’s still hard work investigating all the pieces you need to know in order to solve the mystery. Thankfully, VMware has added the Avi Networks team to the NSX family of products to help us maintain order and keep an eye on the performance of our applications. It ensures that we spend less exercise running around fixing phantoms and more time exorcising problems from our network.


