In today’s IT environments, which are often decentralized due to increasing hybridization, having a top-down view over your entire organization from a single solution seems like a pipedream. Well, Cisco has come up with a solution to hybrid cloud automation through their Nexus Dashboard product, presented at the recent Networking Field Day event.
Managing Hybrid Cloud Environments
With distributed environments rapidly taking center stage for today’s IT organizations, many find that managing their hybrid cloud deployments can be troublesome. After all, in a hybrid environment, there are so many sources of data at play that it becomes difficult to track all of it effectively.
Oftentimes, without a single pane of glass to manage hybrid environments, information becomes fractured and disjointed across data silos, leading to friction. This, in turn, leads to greater overhead costs as multiple members of the IT team need to work to solve the issue.
Tackling the Problems of Hybrid Cloud with Cisco Nexus Dashboard
It is with these problems in mind that Cisco has created their Nexus Dashboard product. Nexus Dashboard centralizes insights for network orchestration and change management, proving 360° visibility throughout a network through integrations with today’s top IT products and cloud infrastructure services.
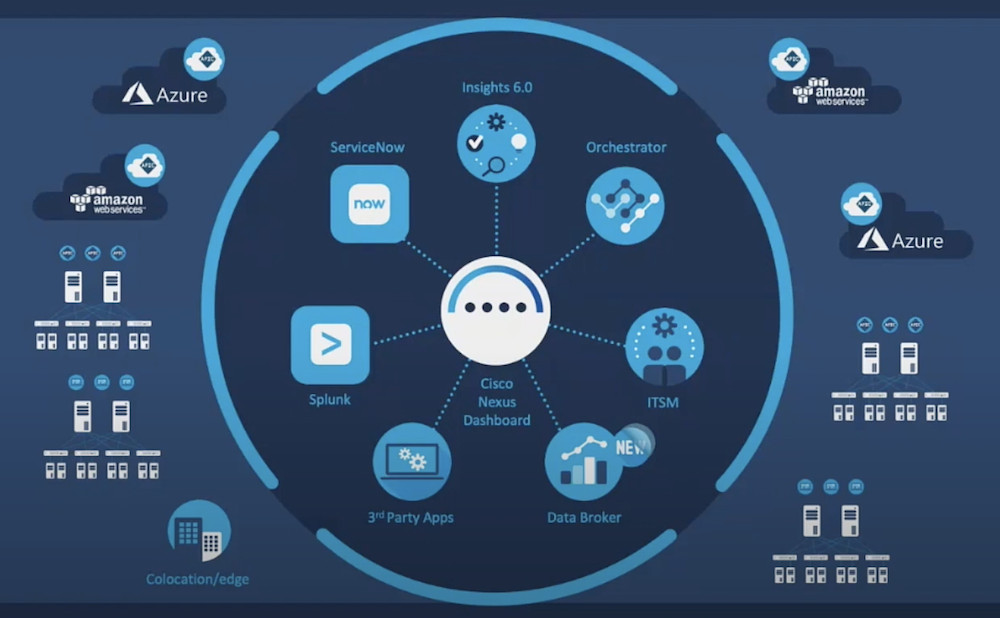
A core goal of Cisco Nexus Dashboard is to provide global access to network visibility, making it easy for anyone from the CloudOps, NetOps, SecOps, or DevOps functions of an organization to hone in on potential sources of issue and setback. In this way, Nexus Dashboard makes it easy for anyone to manage the automation and orchestration of network workflows, services, and applications at scale.
Using Nexus Dashboard in Practice
During Cisco’s Networking Field Day appearance, Azeem Suleman, Director of Product Management, presented an overview of the product. Then, Cisco’s Daniel Pita, Technical Marketing Engineer Leader, provided a demo of the product in action.
In the Nexus Dashboard Admin Console, users can hone in on their sites, services, resources, operations, and infrastructure endpoints that are integrated into the Dashboard. Then, using the single pane of glass UI, can observe their environment from a top-down perspective, including geolocation and real-time alerts for outages.
Armed with this information, IT practitioners and engineers from all business units can implement automation features to streamline processes, making it easy to conserve man hours while also accomplishing repeatable tasks. Nexus Dashboard also sources snapshots, advisories, audit logs, and potential faults, delivering a pain-free method for making the most of a hybridized network.
Zach’s Reaction
Cisco’s Nexus Dashboard consolidates the visibility needs of CloudOps, NetOps, SecOps, and DevOps into a single solution. As such, it improves the general experience of hybrid organizations overall, saving time and money in the process.
Learn more about all of Cisco’s networking products by watching all of their Networking Field Day appearance.