How can today’s IT departments keep up with their massively expanding networks? Kentik offers a solution by way of network observability through their product portfolio, which they presented during September’s Networking Field Day event.
Modern Problems Require Modern Solutions
In many modern IT operations, when an application appears to be unreachable, the first finger is often pointed at the network. Although there are certainly cases when the problem is the network, many of today’s enterprise networks are comprise of many different networks at once including public and private clouds, and as such, sources of potential friction abound.
To keep up with this rapidly decentralizing IT world, IT admins and network engineers need to collect real-time data from across the various endpoints in their multi-domain networks. Not only that, but they also need to be able to make sense of it all through enrichment and analysis.
Moving from Observability to Action with Kentik
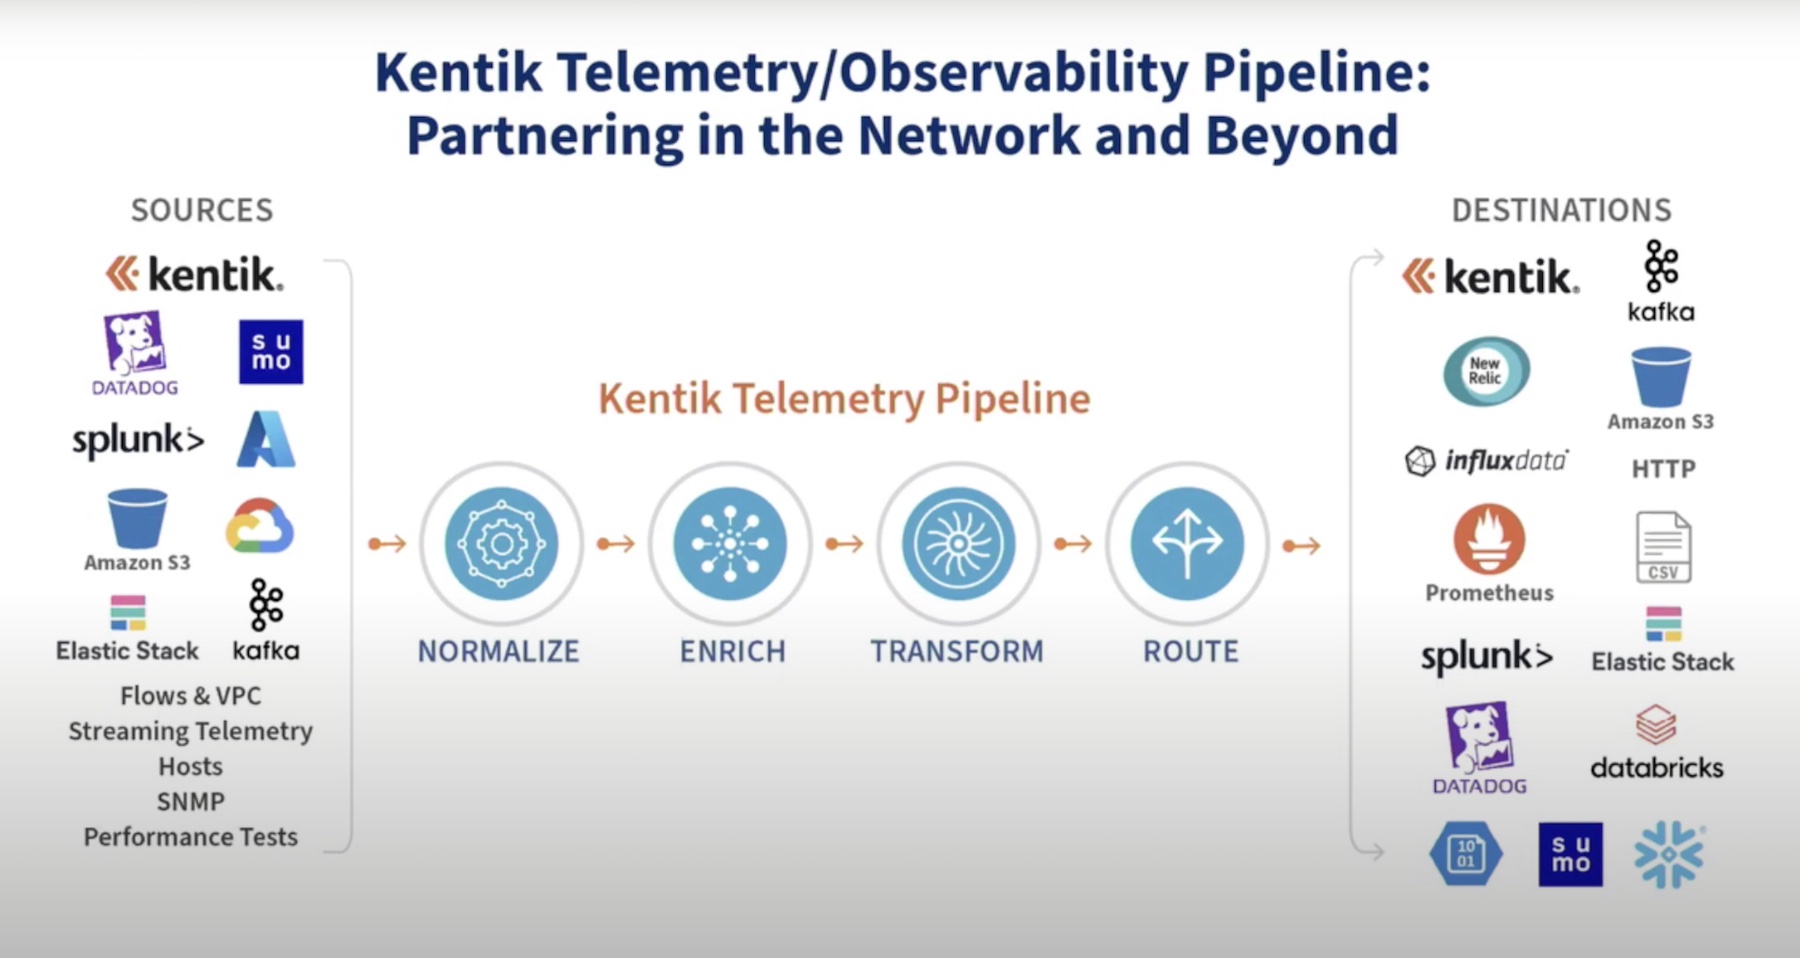
For the folks at Kentik, enabling the utmost level of network visibility is the prime goal. Using thousands of collected data points though BGP, geotracking, clients, applications, and more, Kentik builds a real-time view into how the network is doing, enriching that data through orchestration and other automation functions.
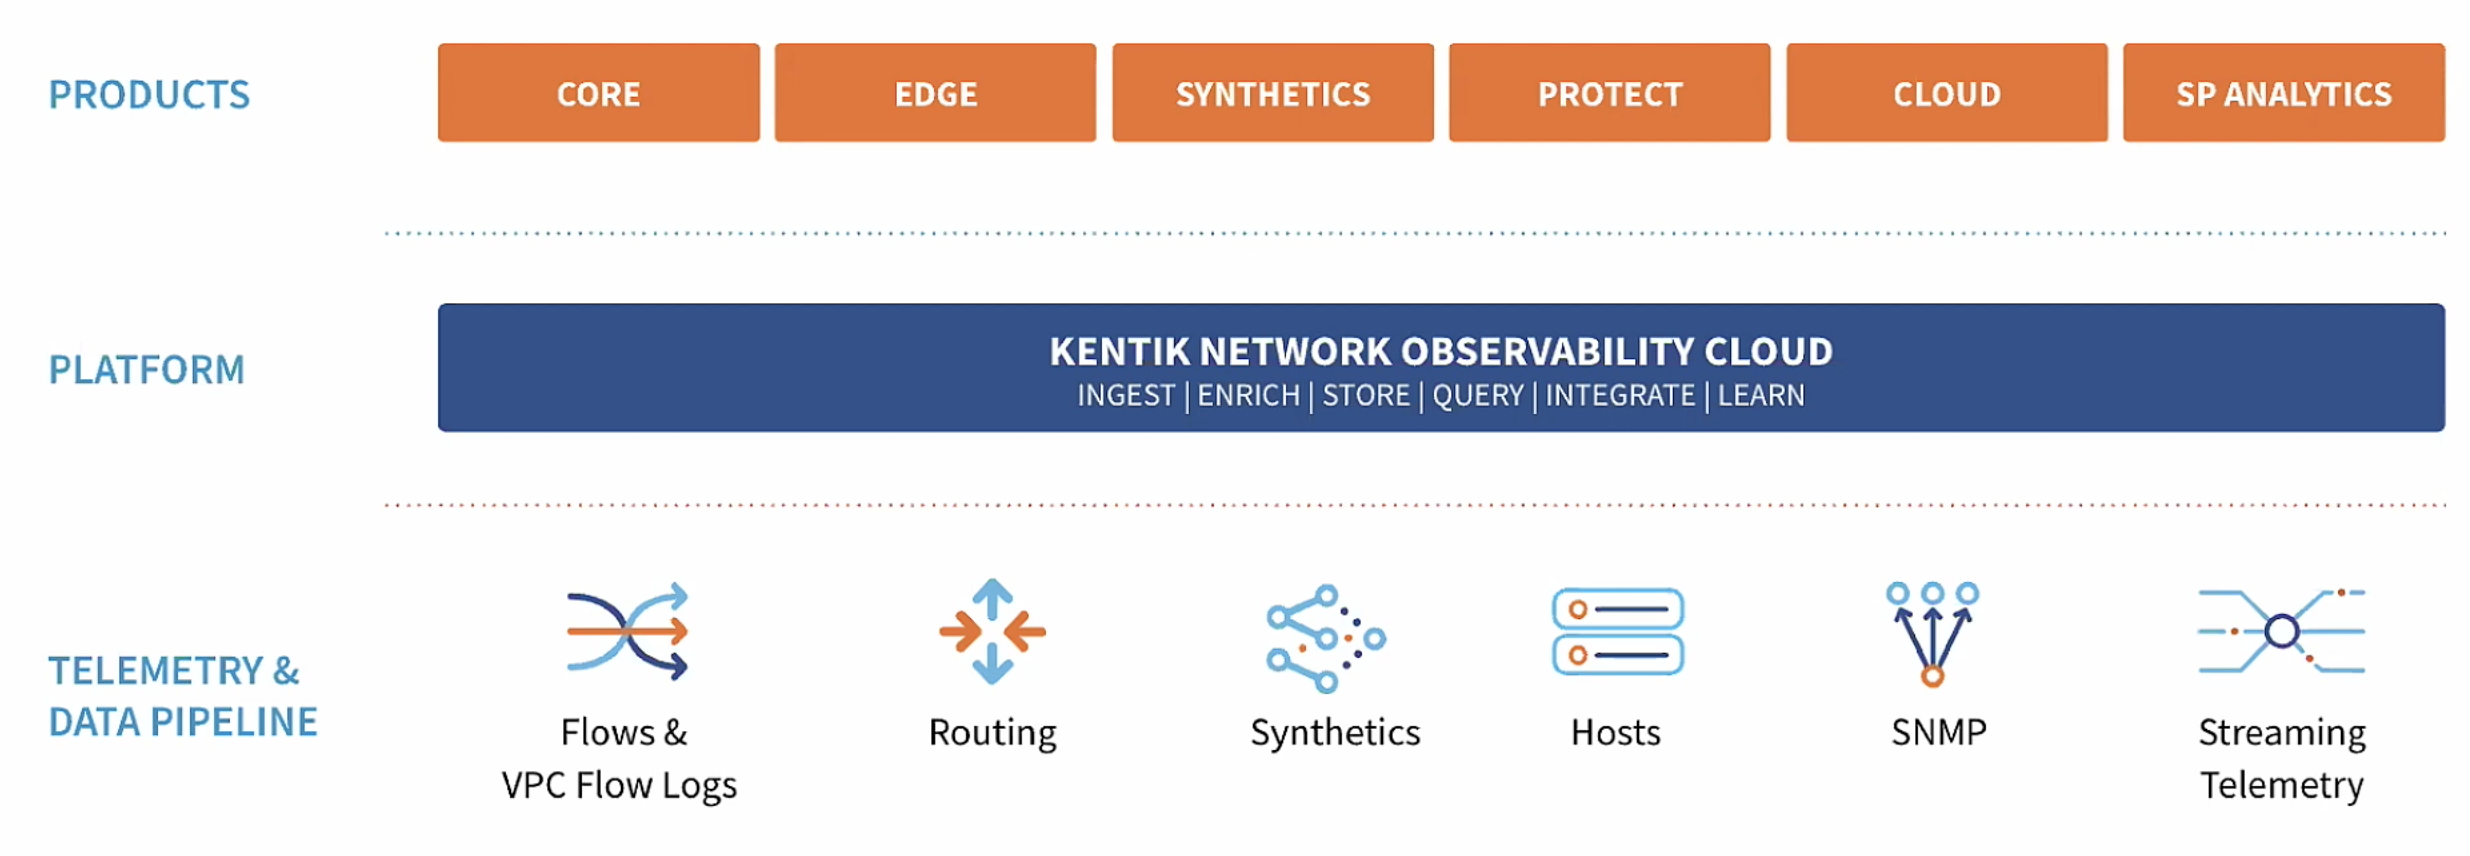
Armed with this data, Kentik then provides actionable insights into the health and status of nearly all facets of the network, elucidating sources of potential concern and providing traffic, device, metadata, and synthetic telemetry to help IT staff better understand their network situation. All of this is ingested into their Network Observability Cloud Platform, establishing a single source of truth for network observability.
Taking a Tour of Kentik
Kentik presented their portfolio at the recent Networking Field Day event. There, Kentik CEO and co-founder, Avi Freedman, gave an overview of Kentik as a whole, as well as a quick tour of their products in action.
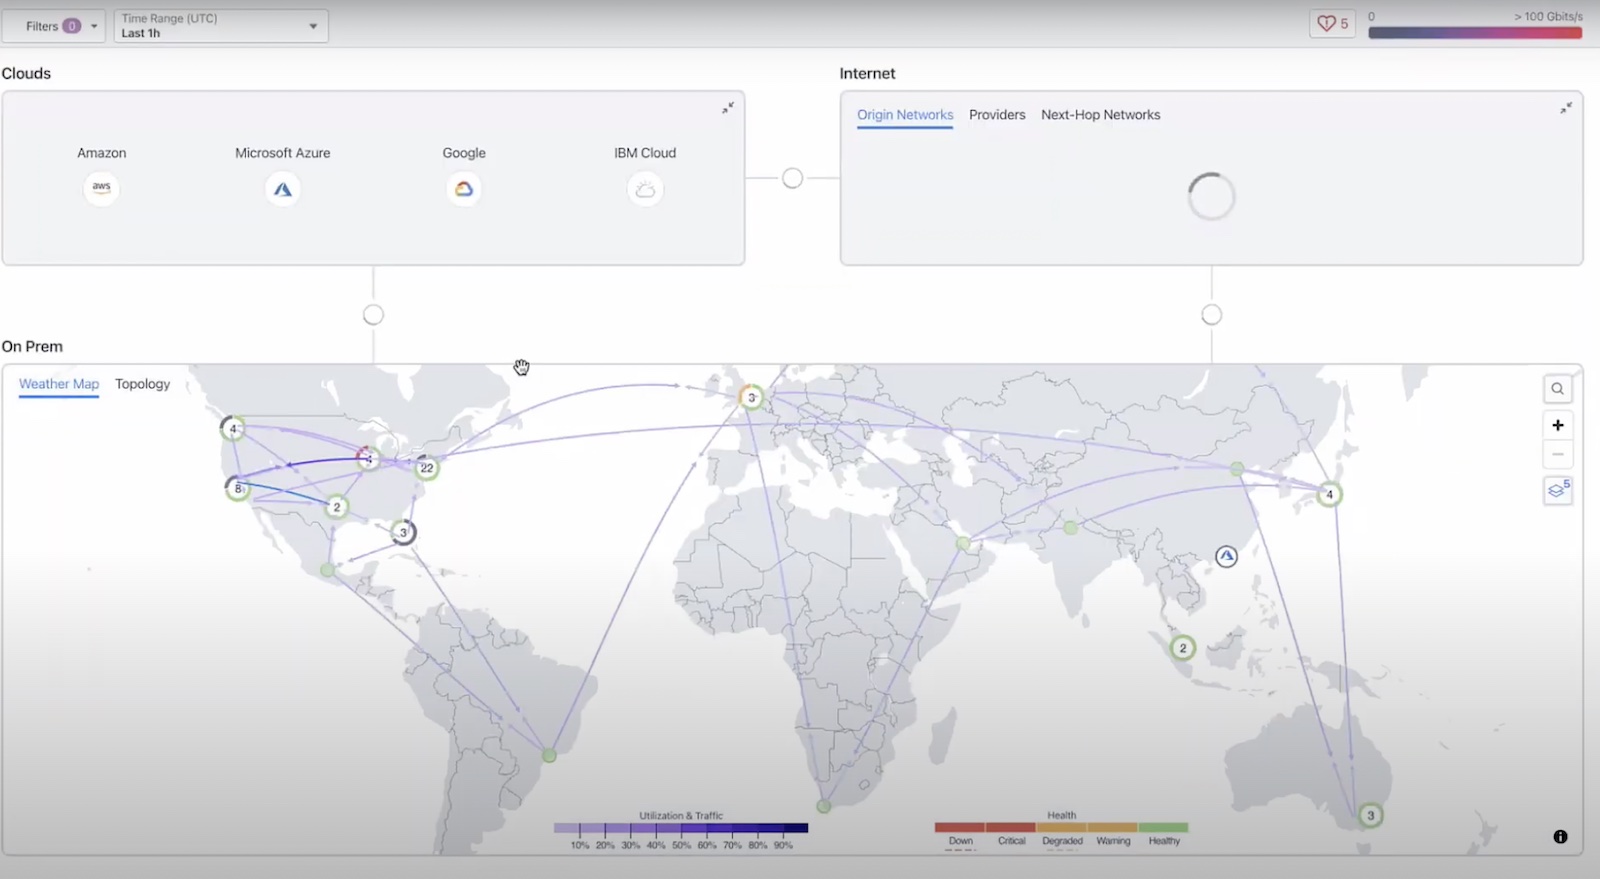
Seeing Kentik firsthand, it’s apparent that their browser-based admin console (shown below) is designed for efficiency. Upon first glance into the product, admins can right away see their network’s performance through traffic metrics, as well as individual site performance across clouds and data centers.
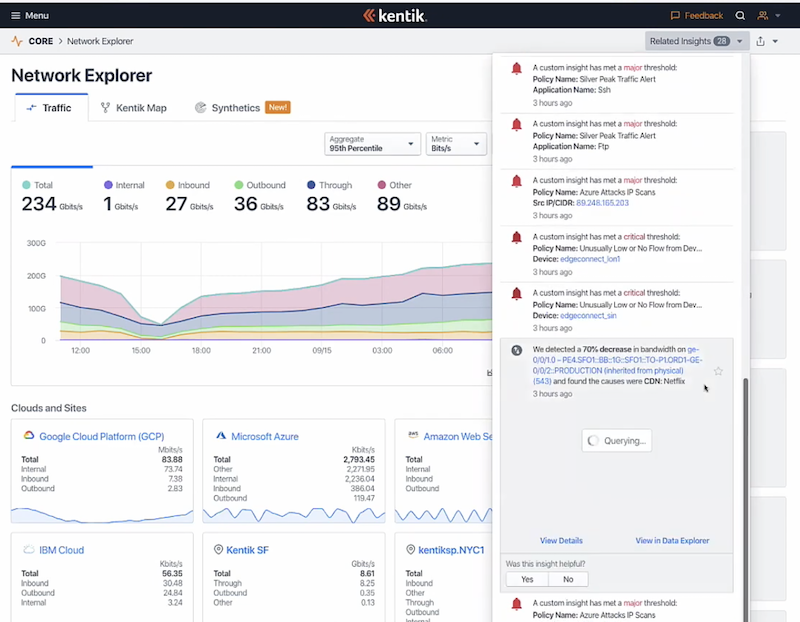
Built into Kentik’s console is an alert feature, which tells organizations when events occur, ranging from simple decreases in bandwidth on an individual device to organization-wide DDoS or similar attacks. That way, admins are instantly made aware when a potential issue arises so they can address it with the utmost haste.
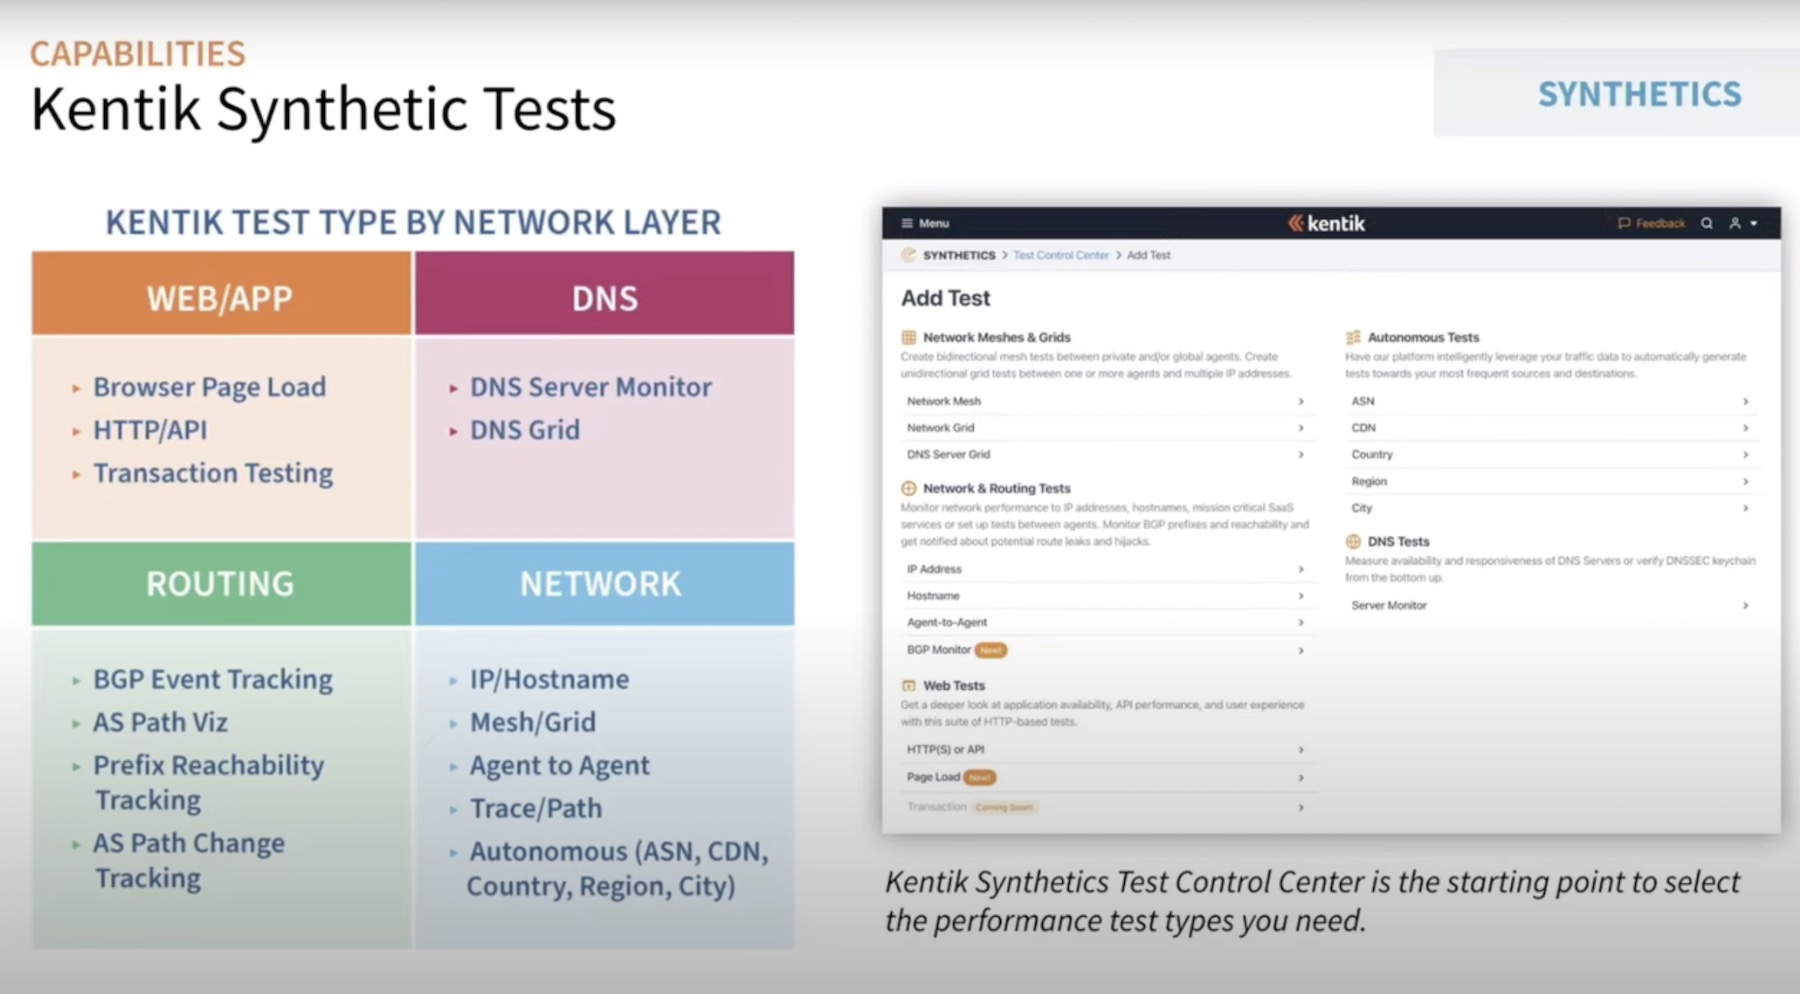
Beyond the view shown above, admins can also use Kentik to see their network mapped out geographically, as well as Kentik’s new synthetic telemetry view. They do an excellent job of explaining it in a different video, so I’ll let you watch it to find out more.
Zach’s Reaction
Kentik takes on the problem of network observability in modern IT operations head on with their product portfolio. They’ve made a number of advancements in their products over the past several months, which you can learn more about by watching the rest of their Networking Field Day presentations, so I highly recommend you do that if you’re interested.