You can skip the hours of work to customize a comprehensive network management system if you look at TotalView by PathSolutions.
Overview
My first impression: I liked what I saw. TotalView’s functionality matches its claims. First up, the solution is easy to install (80MB install image) on a Windows system, which may be a VM. It also features automatic network discovery and association of SNMP/CLI credentials with discovered network devices.
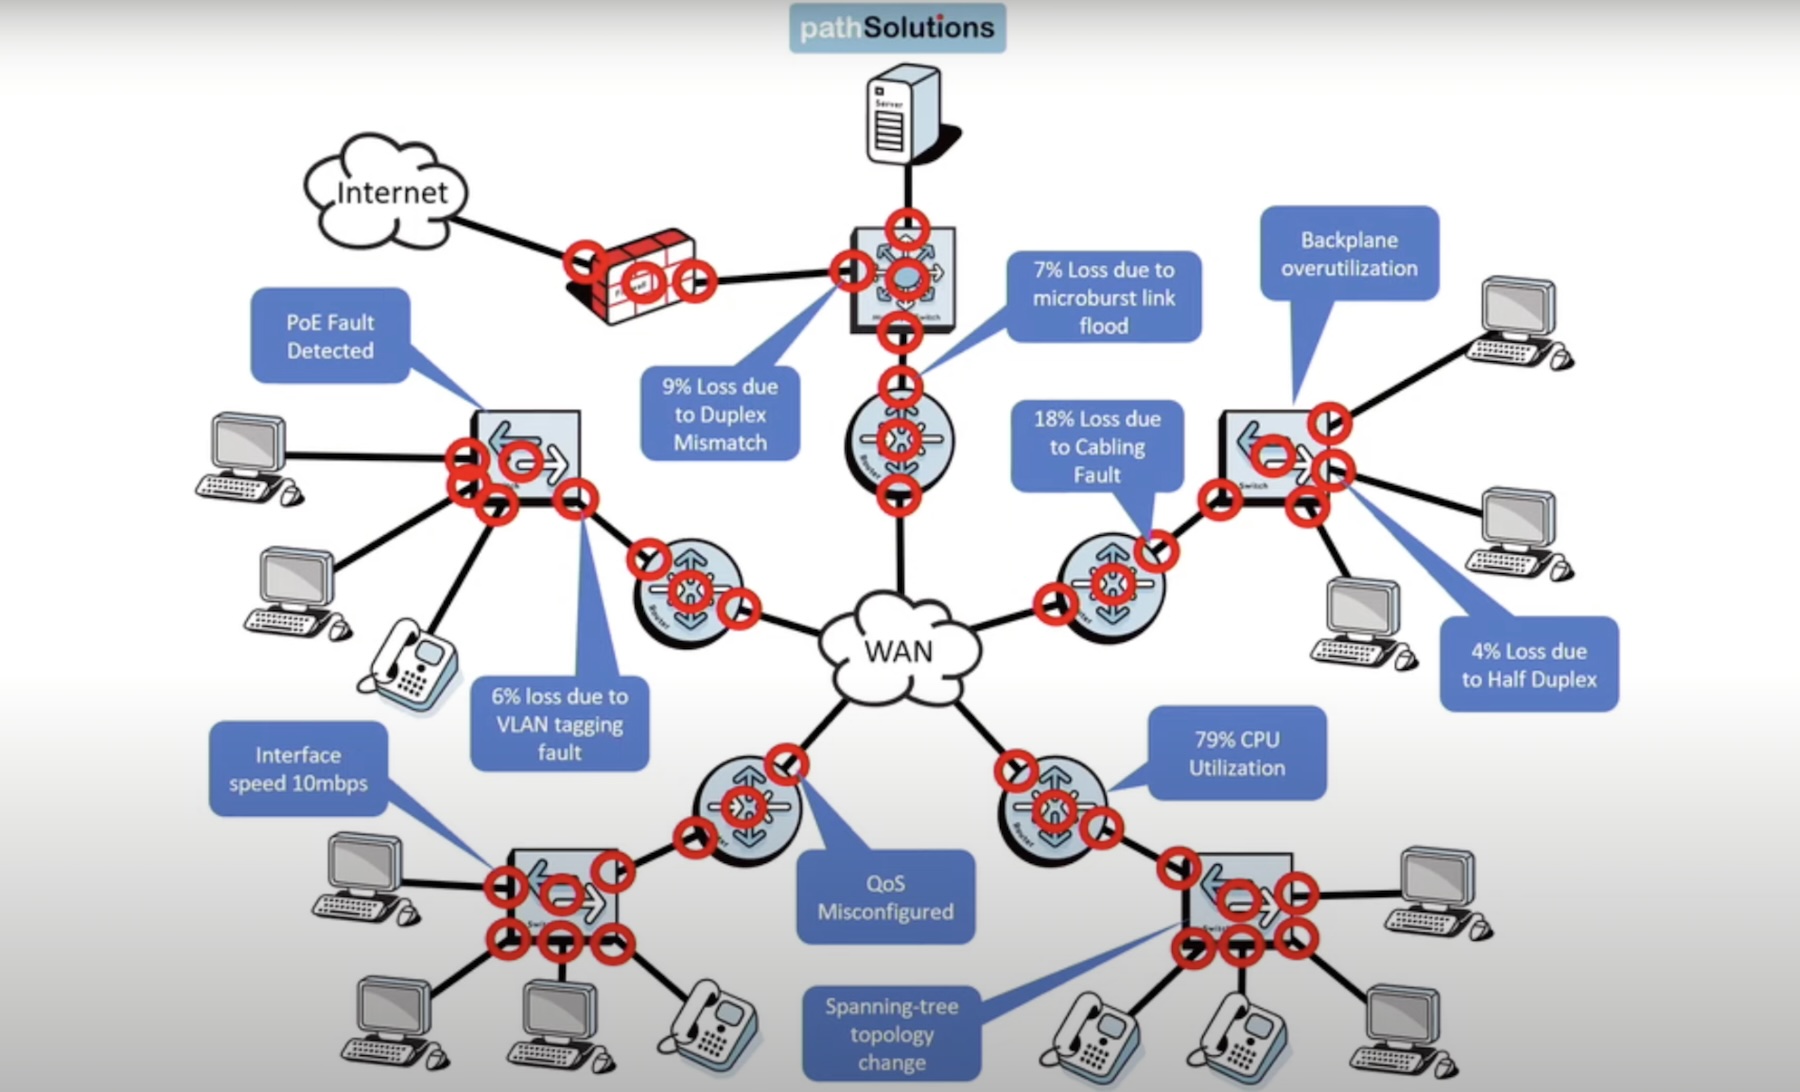
The TotalView device inventory shows serial numbers, modules, and software versions with security vulnerability analysis. The system features an intelligent SNMP polling mechanism that maximizes data gathering. Analysis of that collected data turns it into actionable information that you can immediately use to improve your network (i.e., fix problems).
Users can export the system’s automated topology mapping for documentation purposes. There is also problem diagnosis assistance by showing the path between two network devices and any issues identified in that path.
TotalView also features endpoint analysis tools (a Windows app and WebRTC test capabilities), network device configuration backup, and an easy-to-use web interface.
Easy Installation
Installation of TotalView typically takes a few minutes. Users configure address ranges for the network discovery process and input the SNMP/CLI credentials for network equipment. It stores multiple credentials and will automatically discover which credentials work. It uses the most common ones as it progresses.
Security Note
TotalView will be trying various login and SNMP credentials, which should trigger an alert and perhaps an automation isolation event in your network security systems. It helps to make the network security team aware of this before deployment.
A lot of network management systems then require you to identify which SNMP object IDs (OIDs) to query. TotalView has a great set of defaults already programmed into the system that can be augmented if you have something new in your network.
The system knows how to handle complex SNMP MIB tables, such as the Cisco Class-Based QoS MIB. PathSolutions has been around for about ten years and has an extensive library of data collection and analysis. Many current and old device models are supported.
You should begin to see results within an hour, as it discovers devices, collects data, and begins its analysis. You should start identifying potential problems within this time, even as it continues its network discovery process.
The number of network interfaces to be monitored and the polling interval dominates network management system performance. A single TotalView server can handle a network with 200,000 interfaces at the default five-minute polling interval, and multiple servers can be deployed for more extensive networks. The SNMP requests and replies are optimized to minimize the number of packets and spread out to avoid impacting network devices.
Licensing
Licensing is also easy: it is by the number of interfaces. The number of TotalView servers isn’t a factor. Some network operators may not know the number of interfaces but know the approximate number of network devices. To convert, examine the device inventory information to determine a rough average of interfaces per device. The averages tend to clump around standard chassis and blade sizes, frequently a multiple of 48 ports. Don’t forget to include VLAN interfaces; should there be a large number of them in use. Multiply the resulting interface average by the number of devices.
There are several additional modules, such as the Telecom Analysis module, described below. We didn’t discuss pricing.
Operation
A short TotalView demo showed the analysis capabilities and troubleshooting a typical network problem. The inventory function is excellent for matching with vendor support contracts as well as identifying product security vulnerabilities.
I liked the telecom analysis functionality that made it easy to track down the cause of a problem earlier in the day. This eliminates the all-too-common answer that goes something like this: “Well, I can’t tell what happened then, call me when it happens again, and we’ll take a look.”
You will have to examine the UC system’s call data records (CDR) separately to determine the two endpoints of a poor call and use that in TotalView’s Telecom Ops path analysis. The screenshot shows how TotalView monitors all the devices and interfaces in the path between two phones and highlights problems.
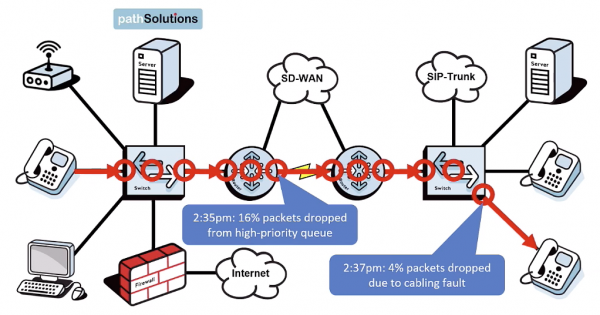
I’ve always recommended that customers build reports to highlight calls with poor characteristics and use that data to drive their analysis. You’ll often find that a single network problem will affect multiple calls, which will cluster together in such a report.
I encourage you to watch the product demo to see more specifics and follow up with PathSolutions for your detailed questions.
Summary
I like the easy install, the fast network discovery, pre-defined data collection, and the built-in analysis that identifies actionable problems that, when corrected, improve the network’s operation. TotalView scales to reasonable sizes at a reasonable cost and is easy to use daily. It is the sort of tool that should be used every morning to see how the network is doing, identify problems, and fix them.
Ease of use is critical. There are so many examples of what I call ‘network management shelf-ware’, which get installed but aren’t used regularly. Stated another way, the best network management system is one that you’ll use regularly.
Learn more at Advanced Network Monitoring & Root-Cause Troubleshooting with PathSolutions TotalView.

