In commerce, digital experience is synonymous with brand experience. Whether a company is selling cars, coffee, or candy, providing a positive customer experience is a non-negotiable part of the deal.
Faced with non-stop competition, enterprises across sectors are trying hand over fist to create the most personalized experiences for their end users. But their good intent is challenged by an obstacle course of unpredictable factors.
In the digital realm, anything can reduce the quality of user experience and precipitate revenue loss. A second’s delay in loading, for example, can drive potential customers away from a website. Or a slow-functioning checkout navigation can give buyers reason to abandon their shopping cart before completing purchase.
“Slow is the new down,” Brandon DeLap, Sr. Solutions Engineer at Catchpoint Systems, comments during a session at the AppDev Field Day event in Silicon Valley. “People don’t necessarily complain on Twitter about a complete DNS failure page, but they do complain if a page is taking 20 to 30 seconds to load, or log in”.
The Inside View
Modern digital environments are a wilderness of vendors, applications, services, and devices. Across the service delivery path, these components cross paths and share touch points.
“Stack applications rely on several different layers and services within those layers,” DeLap says.
In the same breadth, the dependencies make the applications more efficient and secure, as well as unpredictable. While a company’s own applications are its own responsibility, the performance and behavior of third-party apps are not.
“Unfortunately, users don’t know that you don’t have control over those, and it’s very important to be able to have an at-a-glance view into any of those providers at any given moment causing an issue to the end user experience,” he emphasizes.
Internet Performance Monitoring with Catchpoint
A leading monitoring solutions provider, Catchpoint has developed a solution that can curve the most efficient and least painful path to a richer user experience.
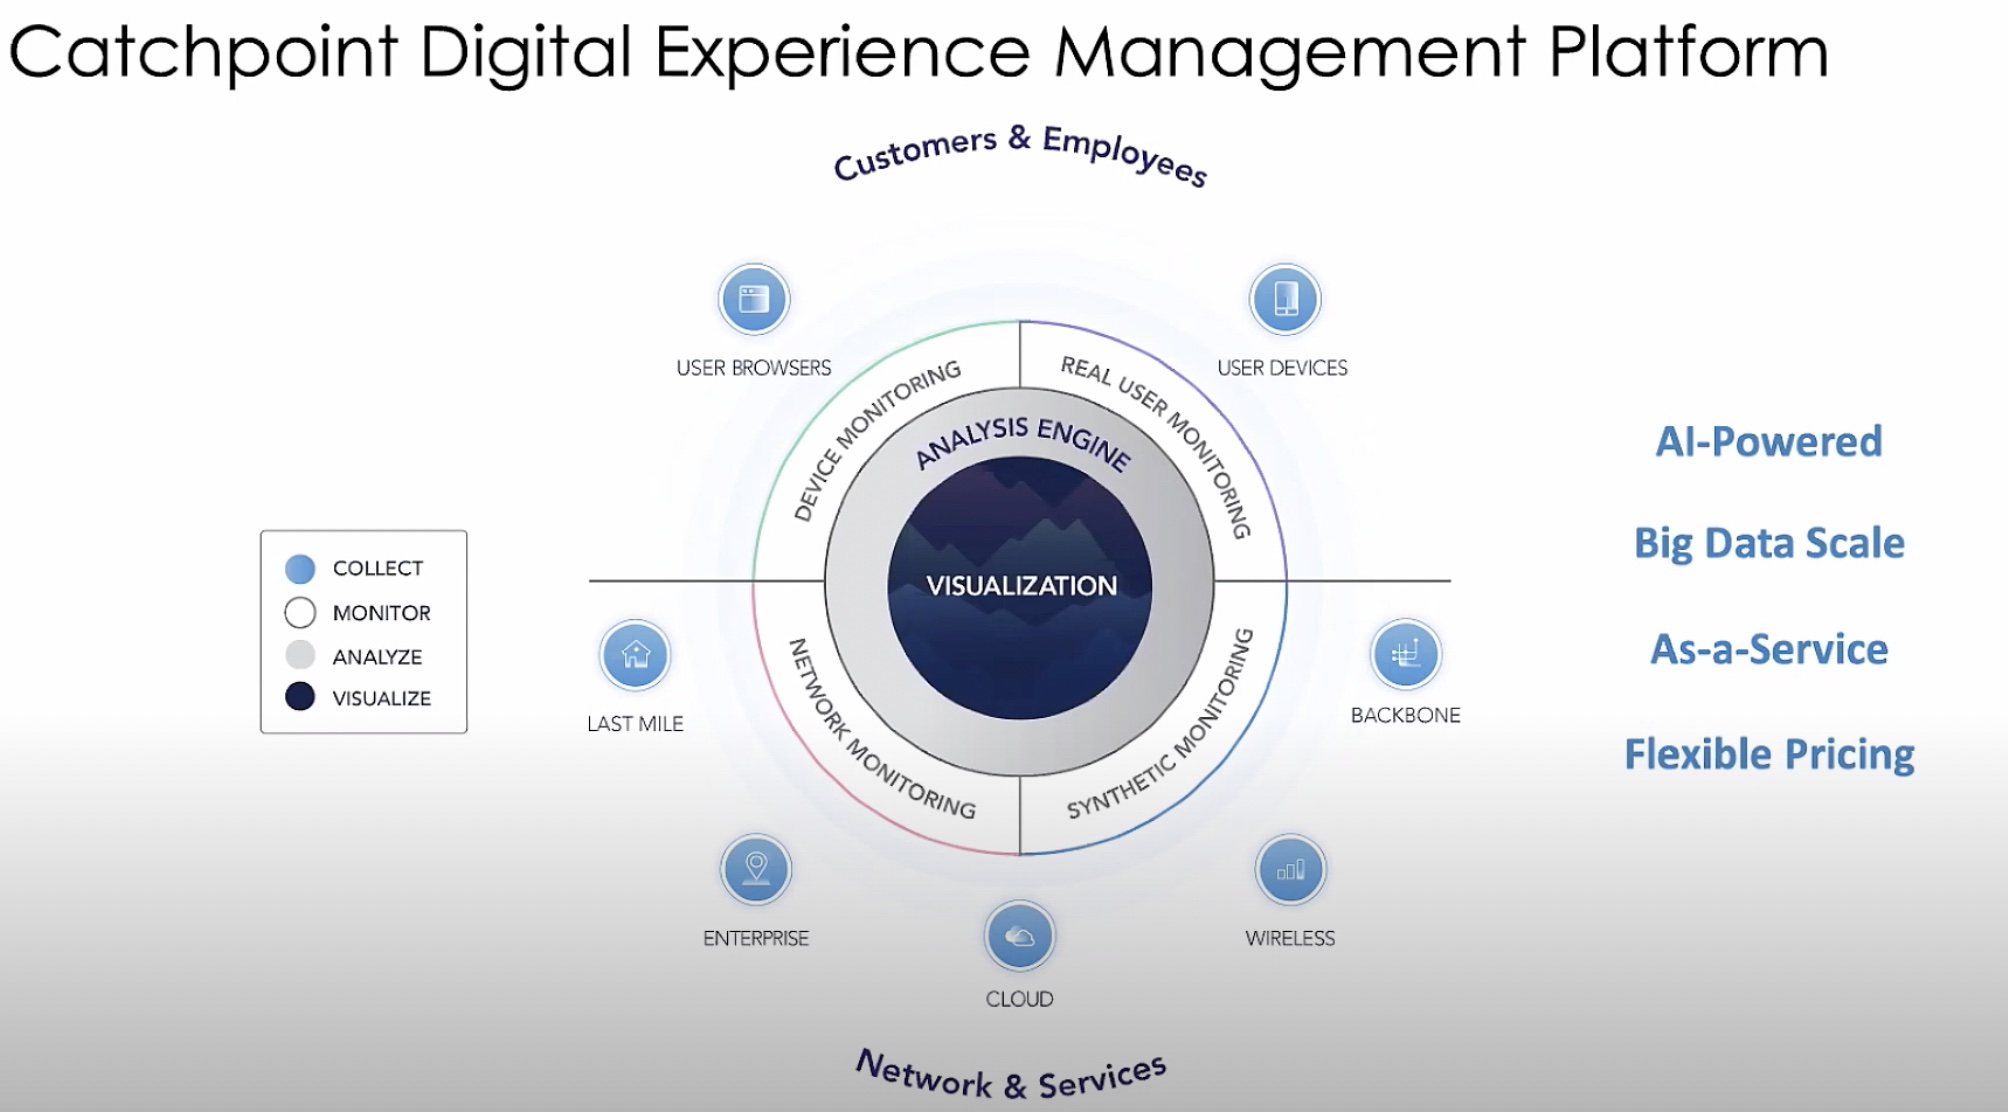
At the recent AppDev Field Day event, the company introduced Catchpoint Internet Performance Monitoring (IPM), a holistic platform to measure and monitor the experiences of not just customers, but also the workforce around the world.
Catchpoint IPM is designed to provide observability leaders a complete picture of the states and health of services across the Internet in a glimpse. The idea is that they have a ready auto-discovered list of issues, the moment they pop up.
DeLap described what the day in the life of a DevOps manager looks like when using Catchpoint IPM.
IPM welcomes all administrators with a default live view of all digital services in the Internet stack, and their current health. These include dependencies, Internet sonar, issues and their severity levels, and alerts.
The IPM platform leverages a spectrum of monitoring and visibility products off of the Catchpoint portfolio to provide this detailed view. These include Internet Synthetic Monitoring, Real User Monitoring (RUM), Internet Sonar, BGP Monitoring, Endpoint Monitoring, WebPageTest and Tracing. This allows it to show simulated feeds, as well as gather actual experiences in terms of service reachability, website speed, and so on, as users are experiencing them.
Internet Sonar is a global heatmap of all third-party services in the stack. When teams are faced with experience-impacting issues, the Internet Sonar serves by providing a deeper look at them.
A heatmap displays the regions of outage in real-time. Catchpoint’s Global Observability Network provides data for this. With data collected from 2600 nodes from 300 providers across 80 countries, it brings back live information and ready analytics. Administrators can selectively pick areas of internet from an adjustable outage timeline to drill down on particular providers or services.
“We include status page updates if the vendor posts it – you’ll see that alongside our telemetry – to let you know that the vendors are working on the problem and potentially, you don’t need to reach out and bug them because they already know about it,” says DeLap.
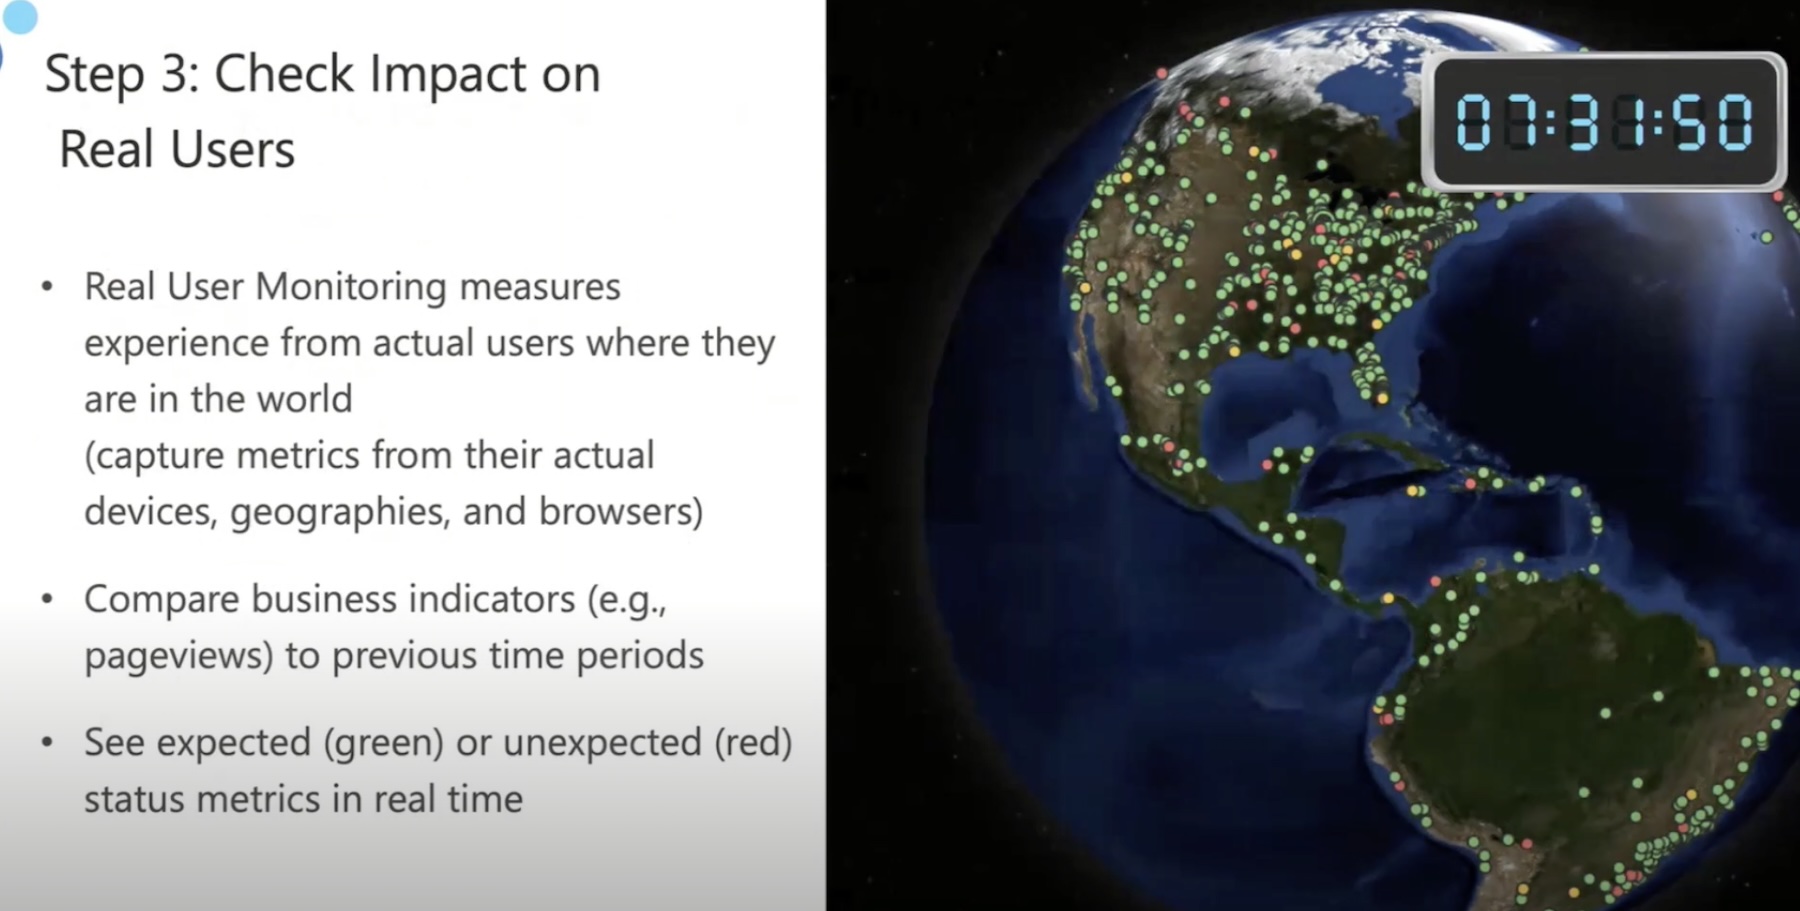
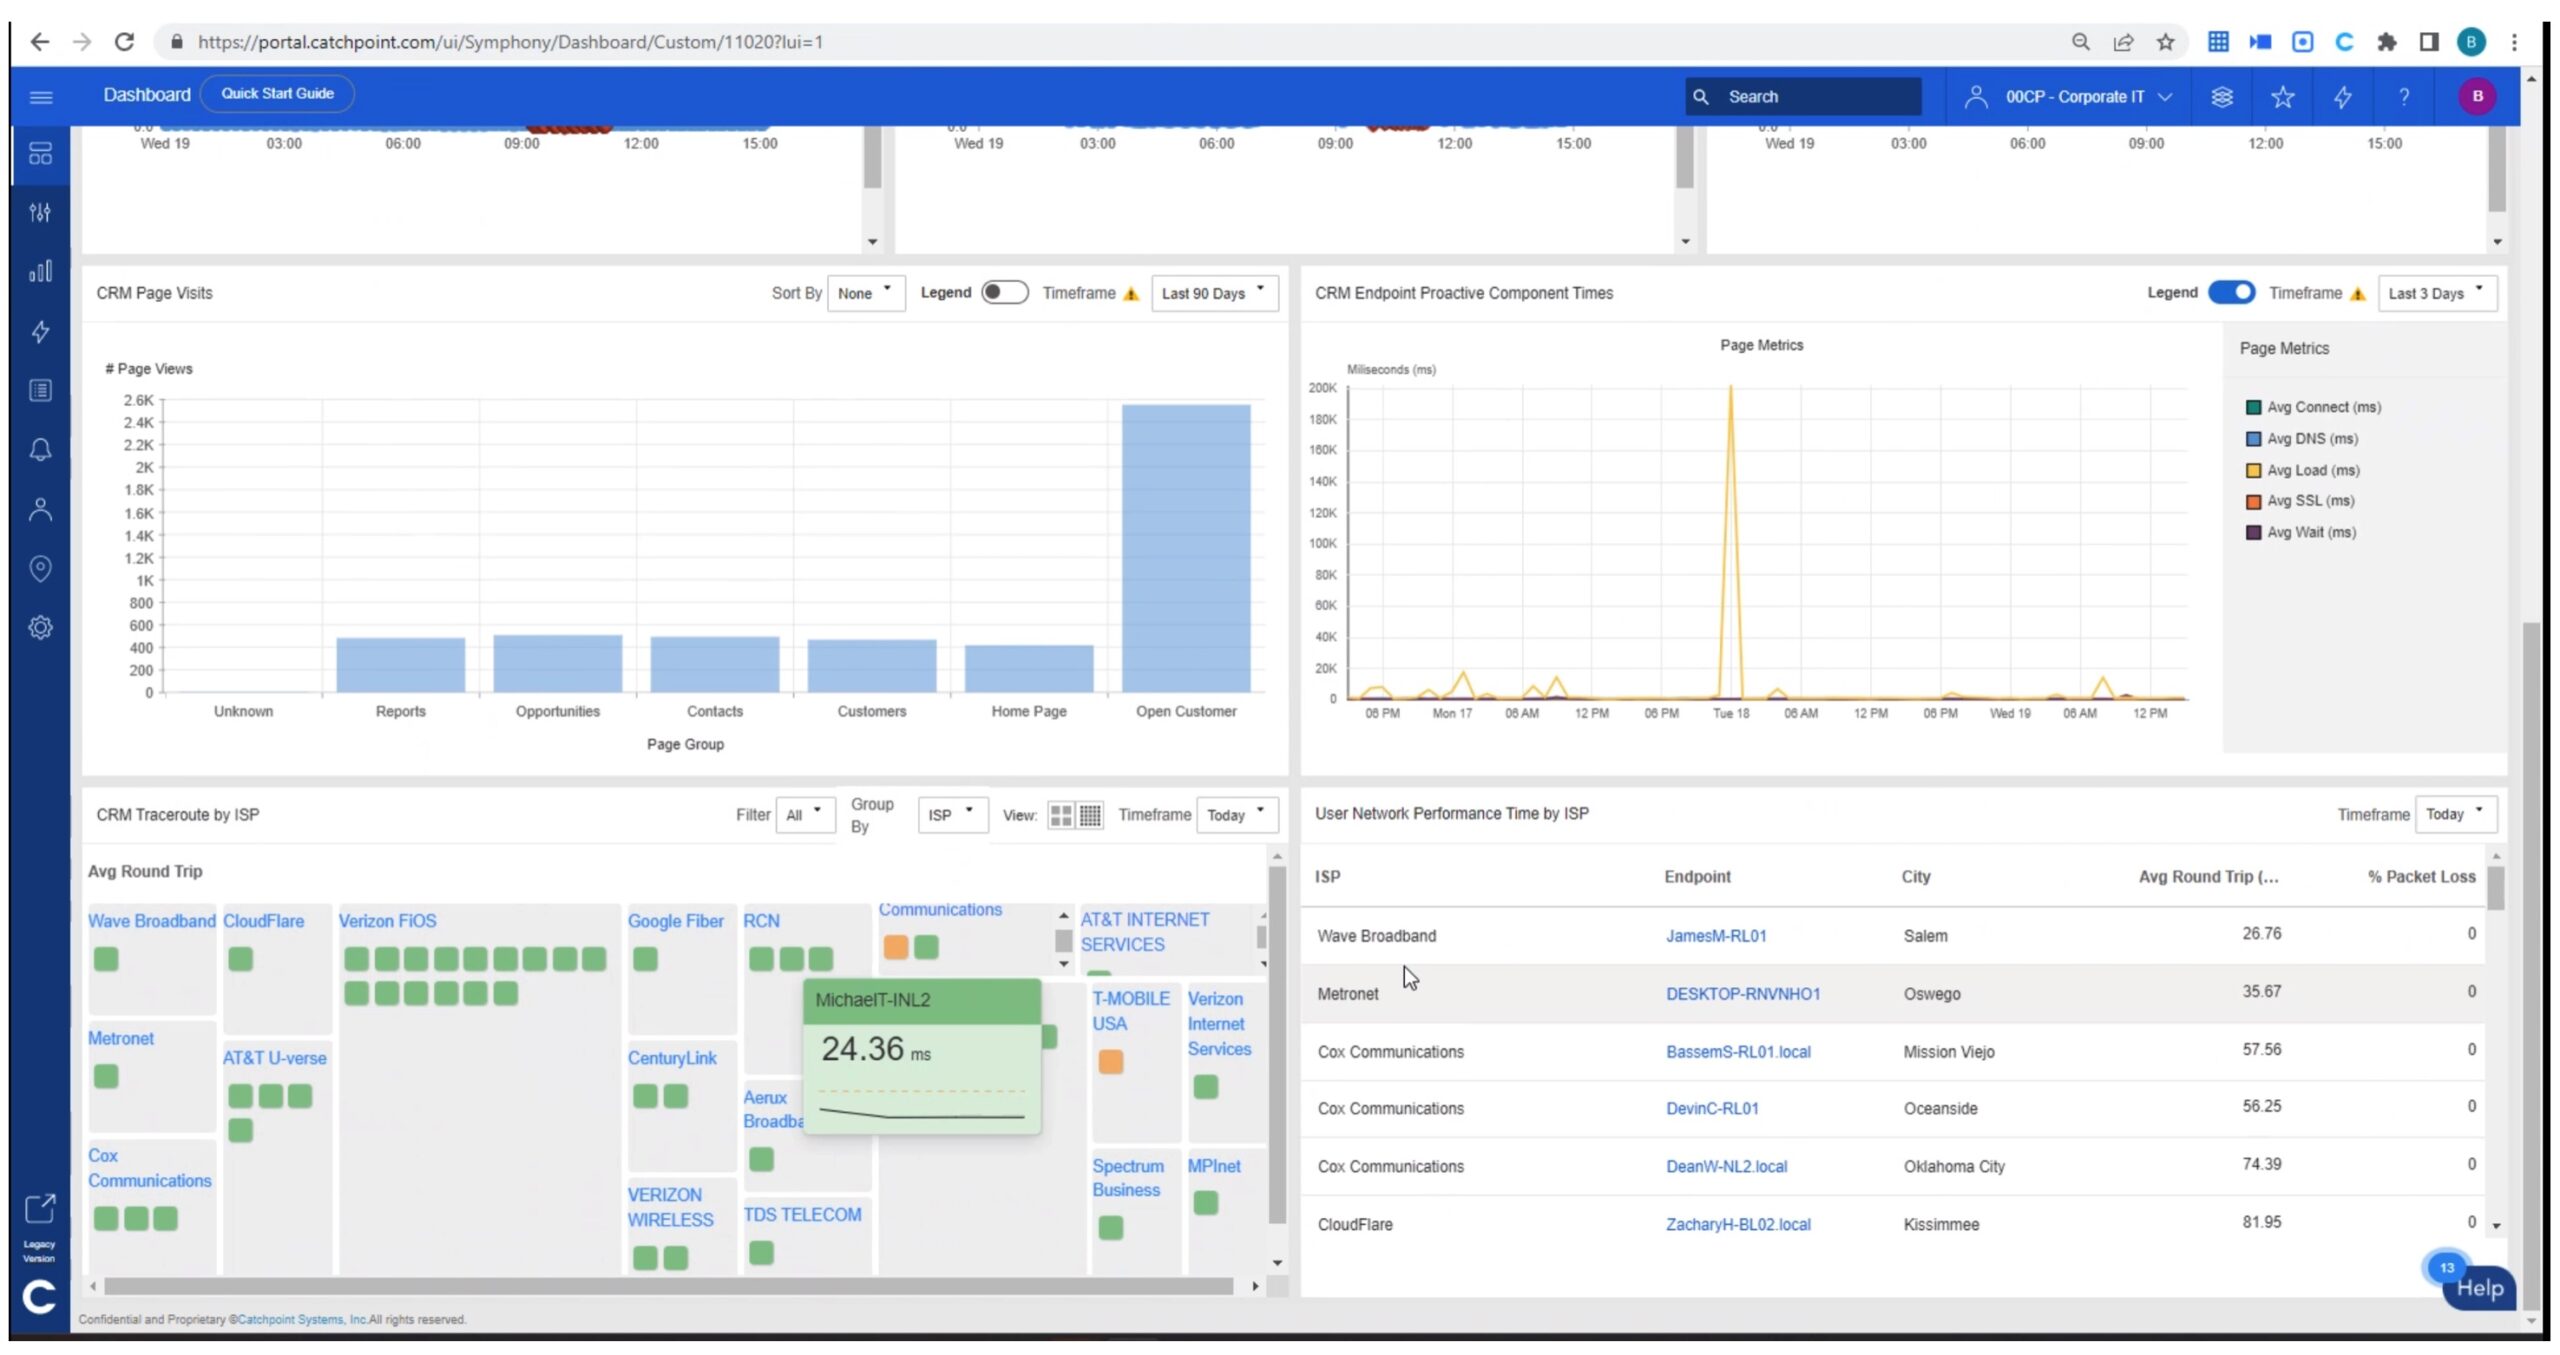
To provide status updates on users in real-time, IPM has a global heatmap of all users interacting with the sites. “This is a JavaScript tag on your site. It’s loaded asynchronous, so it’s not impacting the actual load time of your site which is extremely important,” he emphasizes.
RUM measures experiences through real-world metrics captured from browsers and devices of users in different geographies. Their states are marked in green and red for easy viewing. Business indicators like page views, conversions and bounces can also be viewed and tallied over time, from this view.
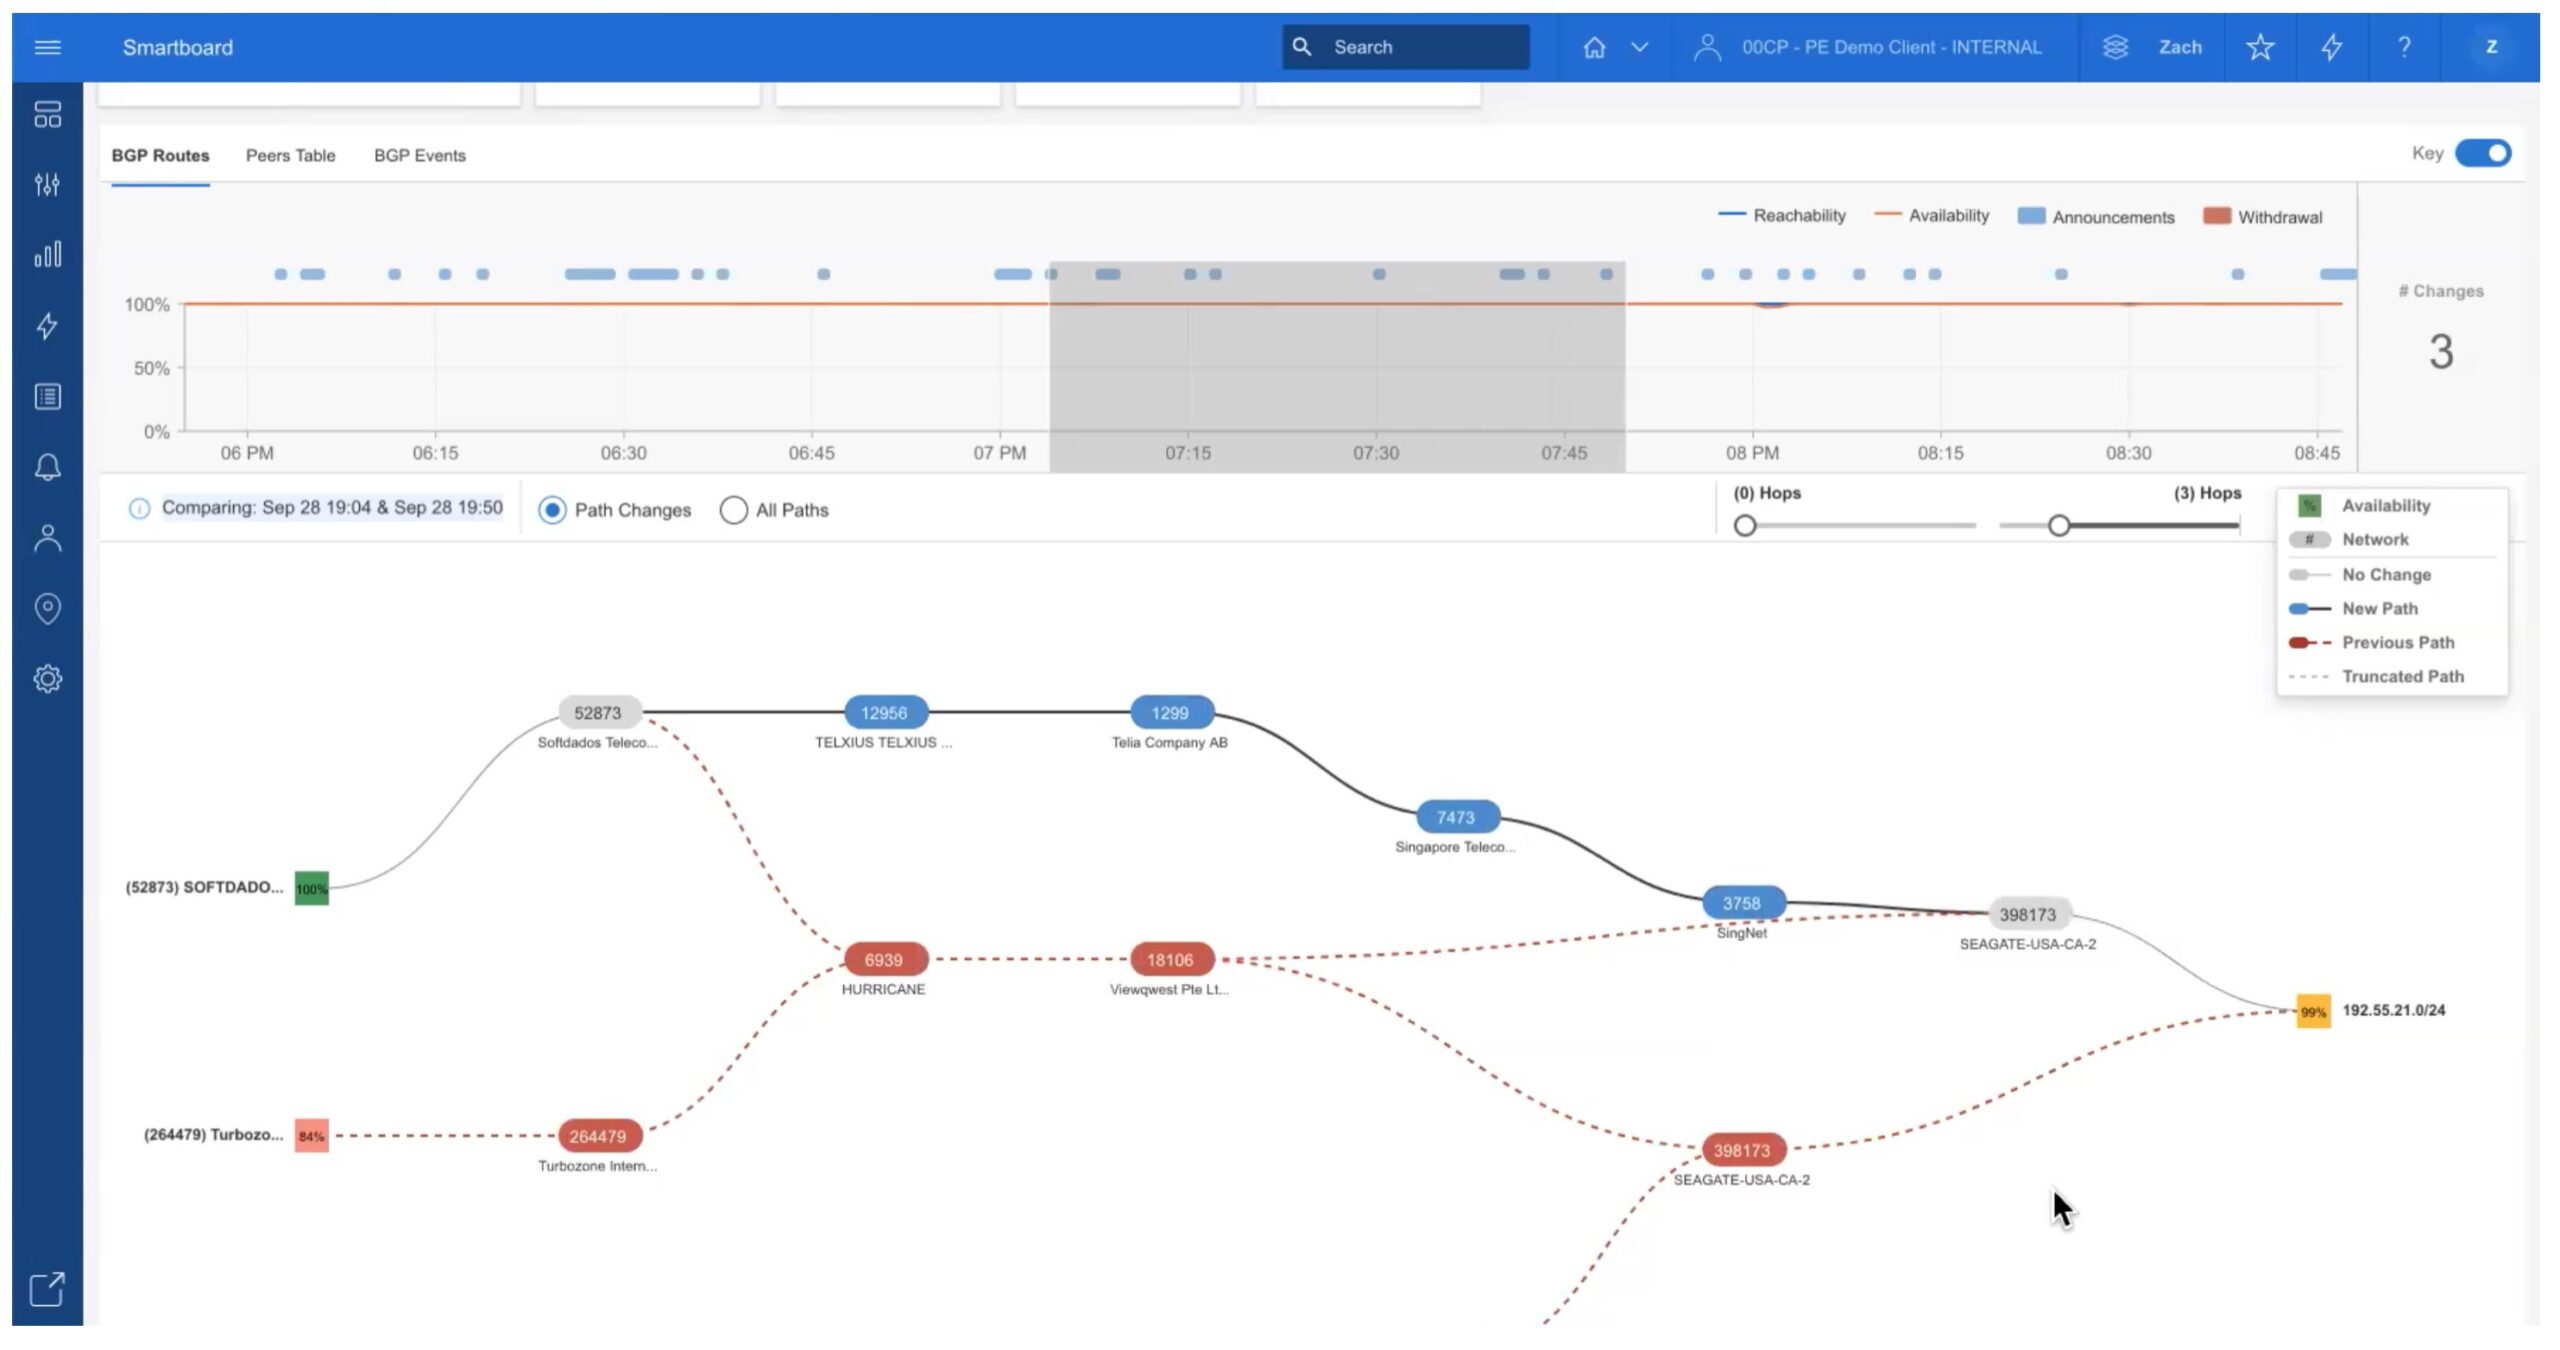
Troubleshooting begins by drilling into BGP routing issues and running DNS tests for reachability. IPM offers a smartboard that provides a converged, AI-powered visualization of the web layer, network layer and BGP layer, for a quick sift-through.
“You don’t have to click through multiple dashboards,” highlights DeLap.
Out-of-the-box, IPM offers 40 synthetic test and monitor types that include API, DNS, Traceroute, BGP, etc. – and unlimited bring-your-own options.
“That may seem a lot, but synthetic monitoring is not just a simple ping or a web check,” he points out. “It’s much more. There are a lot of different protocols that you must test individually from the entire picture or that end user experience, so that you can detect quicker and quicker. The dedicated monitor would alert and notify you of the issues so that you don’t have to go and bug other teams.”
Tracing is helpful to verify issues. “With our Tracing feature, through OpenTelemetry, you can click into a view similar where we’re actually tracing every individual call from the application perspective – database calls, web service calls – and we are able to let you know exactly what happened in that instance or in those synthetic events.”
With IPM providing a one-dashboard view of all elements, dependencies and issues, the entire operation takes less than 5 minutes.
Using these inputs, the front-end development team can then leverage WebPageTest, an open-source product and part of the Catchpoint dashboard since last week, to run tests and find areas to improve and optimize.
Wrapping Up
When administrators wake up to inboxes filled to the brim with alerts from monitoring solutions, it hardly prompts immediate action. Not all of that information is valuable, and without a streamlined view, it is a hunting and pecking game. A platform like Catchpoint’s cuts the clutter, offering pinpointed inputs with granular details. The information is well-targeted, fleshed out and plainly visualized for easy and quick consumption. The deep visibility enables operators to deploy quick fixes to existing problems, and watch over and enhance every customer’s experience across every interaction, around the clock. In the long run, that translates to personalized user experiences for all, and uplifted ROI for the business.
Check out Catchpoint’s sessions from the AppDev Field Day for more on this. For more interesting reads, check out Sam Holschuh, Alan Shimel and Paul Nashawaty’s stories on Catchpoint.