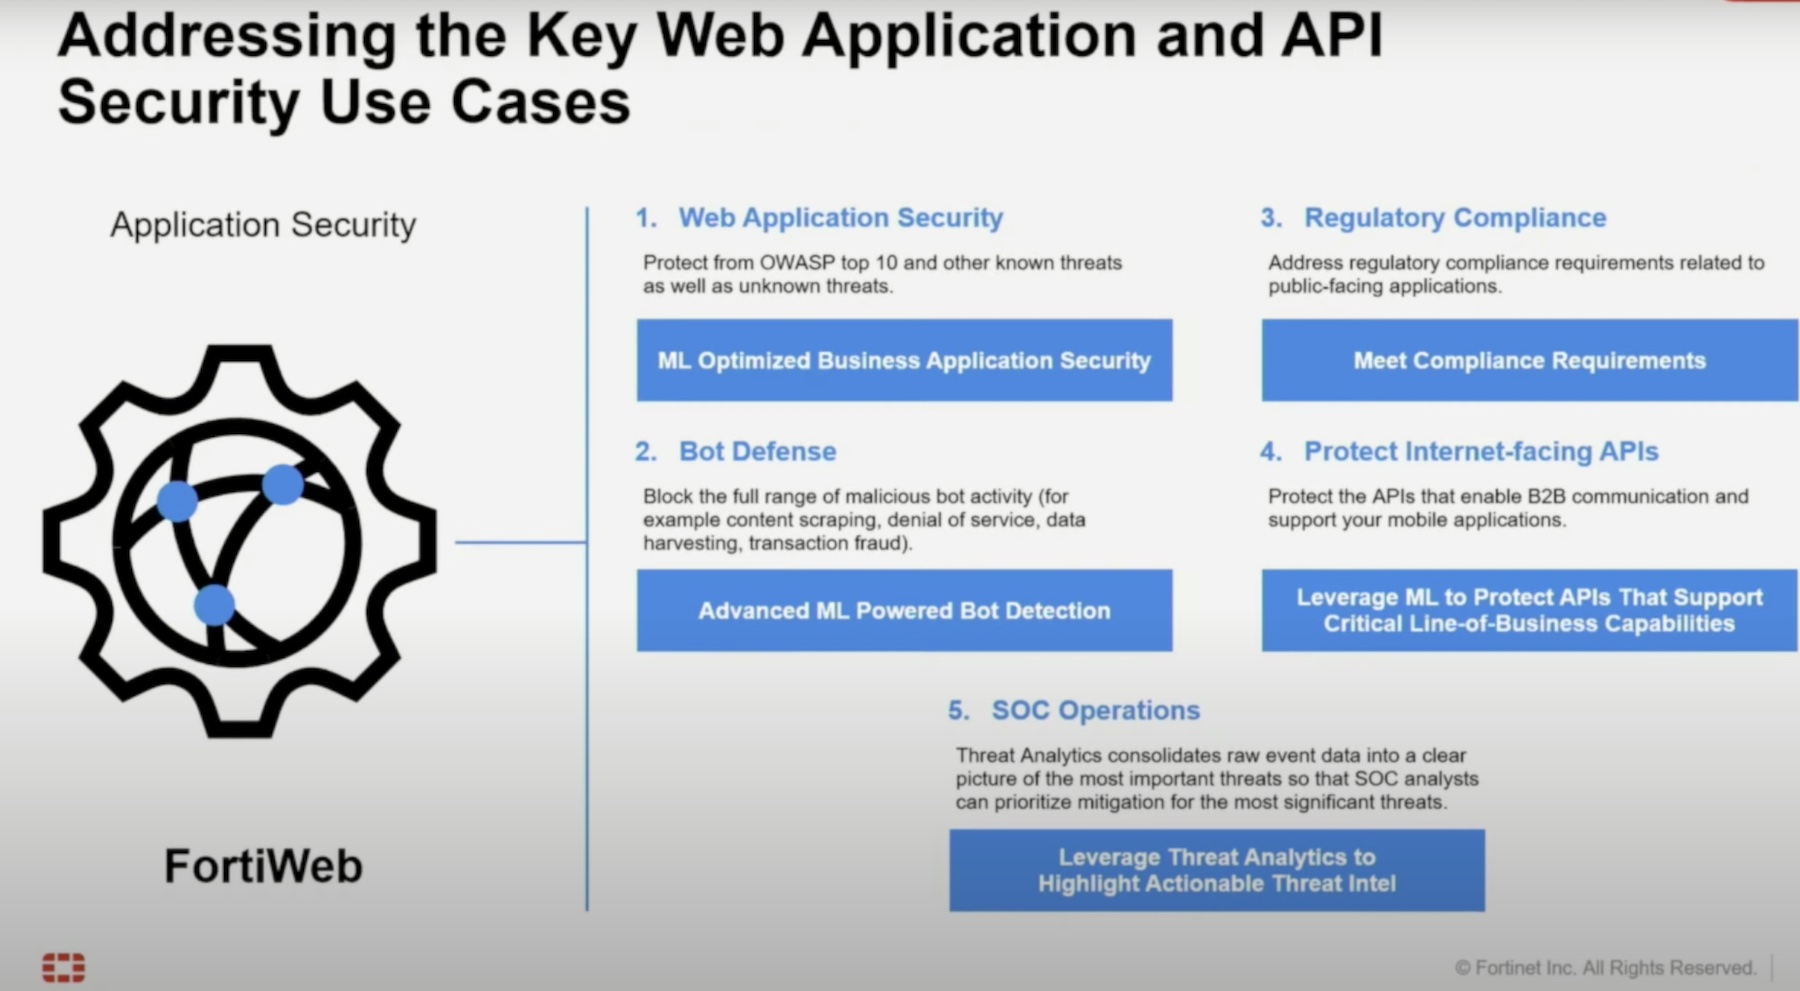
We’ve all seen a dashboard in our careers. The visual representation of data collection distilled down into the easiest method on the planet to communicate data. The metaphor we’re all familiar with is the stoplight system. Green things are good. Yellow things should be considered with caution. Red things are bad. It’s almost elegant in simplicity. And it’s just as infuriating because it lacks context.

Why did the light move to red? Was it because a threshold was triggered? Or is there some kind of special condition that automatically sets a system to yellow or red? Maybe it was something that was recently released, like a CVE? What if there’s no patch for that CVE right now? Does the light on the dashboard stay red until something is released? We could also talk about red light fatigue causing people to just overlook systems that have been critical for too long because they’re either still working just fine with a problem or they can’t be fixed and the issue can’t be ignored.
When it comes to evaluating the cybersecurity risk for systems, you have to have context. You need to know what is causing that alert to be triggered. You also need to collect insights from more than a handful of systems. The current defense-in-depth method is designed to make one or two systems difficult to leverage in an attack. But what if someone is capable of attacking across six or eight different vulnerable systems to gain entry to places they shouldn’t be? How do you stop that?
Graphical Risk Assessment
During the 2020 RSA Conference this year, I had a chance to sit down and talk to Syed Abdur, Senior Director of Products for Brinqa. They’re tackling the cybersecurity risk management problems with the help of big data and graphs. Because you need one to build the other you have to know how to put everything together in a way that gives you a complete picture.
Brinqa has connectors between their platform and other programs. They can collect data from asset management tools, threat intelligence platforms, application security tools, container security systems, and so on. But Brinqa also includes other secondary sources like penetration testing reports, network management tools, security advisories, and even business context from outside applications.
What does this all mean for the data? I think the biggest thing to take away is that Brinqa is building connectors to get lots of data to build their platform. This isn’t just getting simple SNMP trap data from systems. This is more than just getting a list of CVEs from a website and correlating that data. Brinqa is pulling in data from all the sources they can find. They spend a significant amount of their time building the connectors to these applications and data sources. This means they are constantly on the lookout for new data repositories and sources to include in their data lake.
With all this data Brinqa has moved beyond a simple dashboard. Instead of simple stoplights, Brinqa has built an entire graph dedicated to giving more data than can be conveyed in just three colors of lights. The graph helps build relationships between all the monitored applications. Now, instead of trying to figure out what connections exist between your important customer-facing app you can easily see all kinds of data. Including vulnerability reports, penetration test scanning attempts, and threat intelligence information. That graph feeds into risk scores that highlight critical vulnerabilities as well as at-a-glance information.
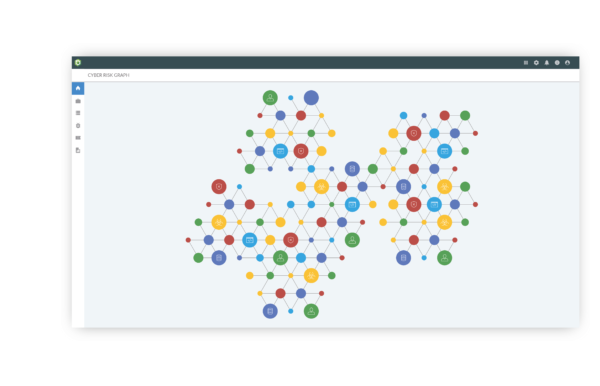
But instead of using the worn-out stoplight visualization, Brinqa presents the info in ways that convey important while also providing areas to drill down into. A key differentiation point is that Brinqa gives you the ability to take action from the dashboard to execute actions that can improve security posture. Because of the connector system, you can deploy a variety of fixes across the entire graph quickly and easily. So if you need defense-in-depth to counter a particularly nasty bug, Brinqa helps you get that depth in no time thanks to their ability to gather data and push configurations to those systems.
Bringing It All Together
Cybersecurity Risk Management is something that sits outside of my typical purview. I know it’s important to understand but there’s a lot to wrap my head around. But what I don’t want is a simple system that just tells me everything is fine all the time or that things are broken constantly without a way to fix it all. Instead, the happy solution is finding a way to convey the necessary information to me while still allowing me to dig into things to understand the data behind what I’m being shown. It’s a way to put me at ease and sate my curiosity at the same time. With Brinqa, the graph solution is better than any stoplight could be.