Organizations face significant headwinds as networks continue to grow, bringing home disruptions on various fronts. This is driving the need for operational resiliency, and a unified experience akin to the cloud.
At the Tech Field Day Extra at Cisco Live EMEA 2024, Cisco announced Cloud Monitoring for Catalyst Wireless. Following the launch of Cloud Monitoring for Catalyst Switching support a year back, this release expands on it offering Catalyst users a holistic, cloud-managed IT experience.
“Operating networks can be time-consuming and cumbersome. So we want to be able to simplify many of the functions of network operations and do a single platform with dashboard,” said Scott Irey, Sr. Technical Marketing Engineering at Cisco.
An Integrated Approach
Over the course of a day, network operators are required to dabble in miscellaneous tasks. These include but are not limited to event monitoring, problem analysis, performance monitoring, and incident response.
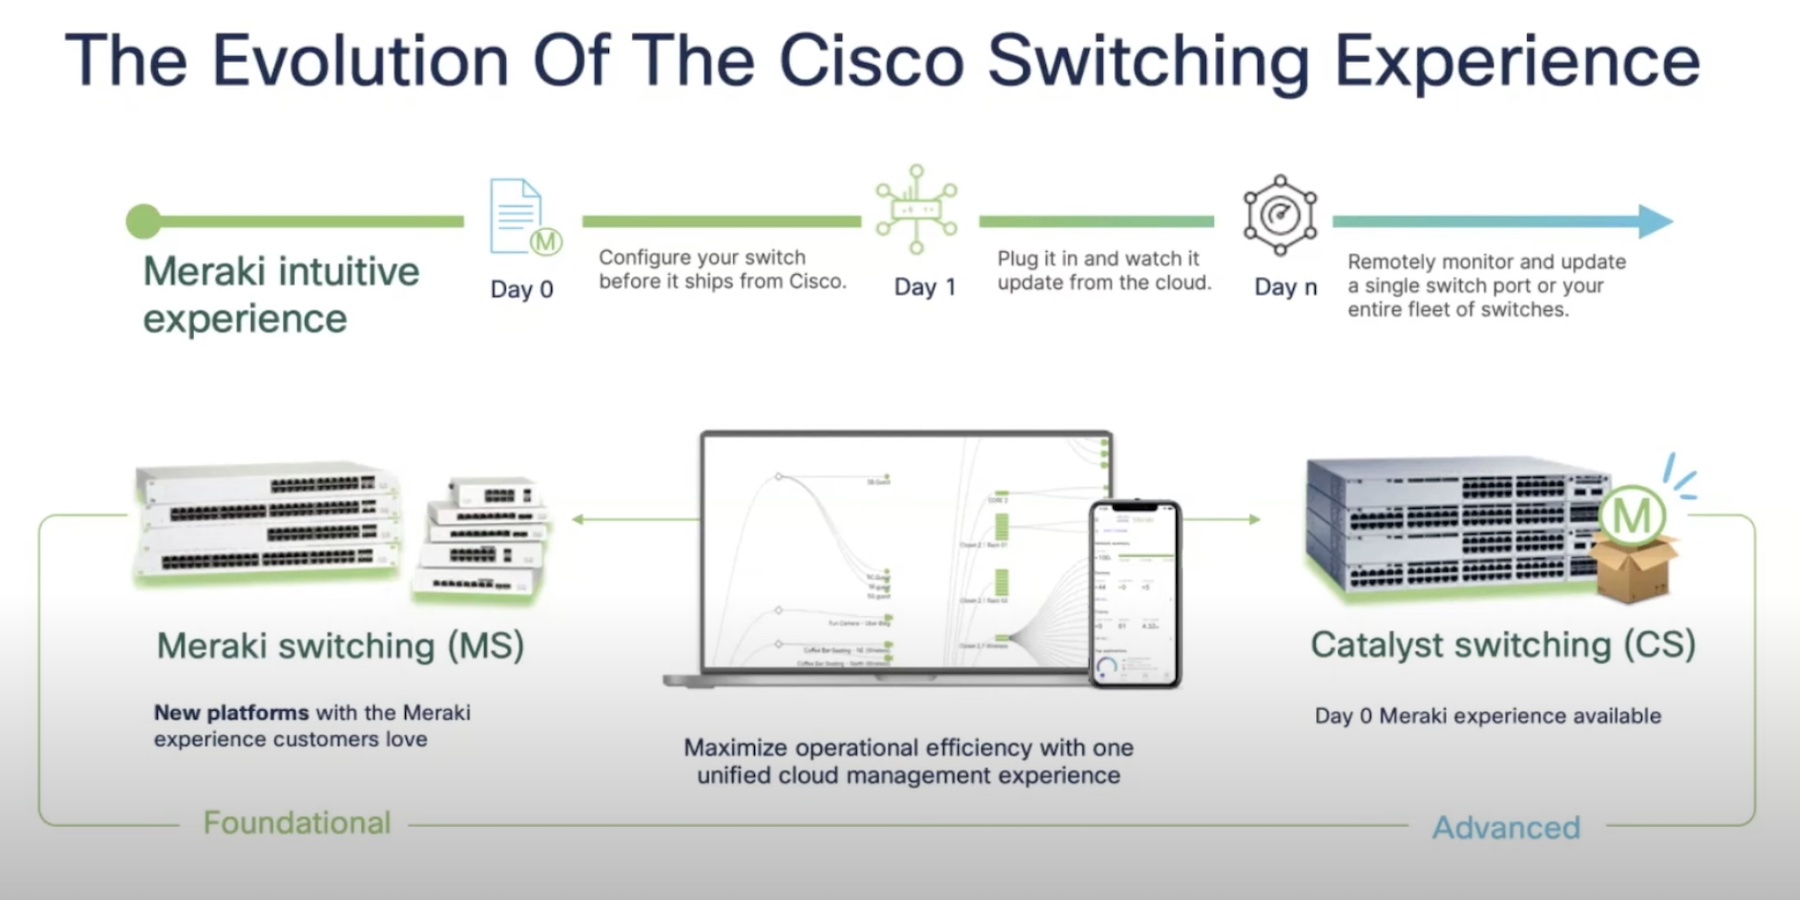
Cisco is adopting a cloud strategy for its Catalyst portfolio, and as a first step towards that, it has merged Catalyst and Meraki allowing Catalyst customers to monitor and manage their gears on the Meraki Dashboard.
“Two features are coming very soon to switching and we will have them in wireless,” Irey announced. One of them is Configuration History which will be available on the dashboard. “For your Catalyst devices, we’ll be able to take backups of your running configuration and store those in dashboard. You’ll also be able to see diffs of those configurations and restore them quickly and easily with a copy button,” he explained.
There is a rich set of pre-built packet capture features available within IOS-XE. But it entails using commands through CLI. Cisco has been working on bringing features like it to the dashboard, making them readily usable with just a few clicks.
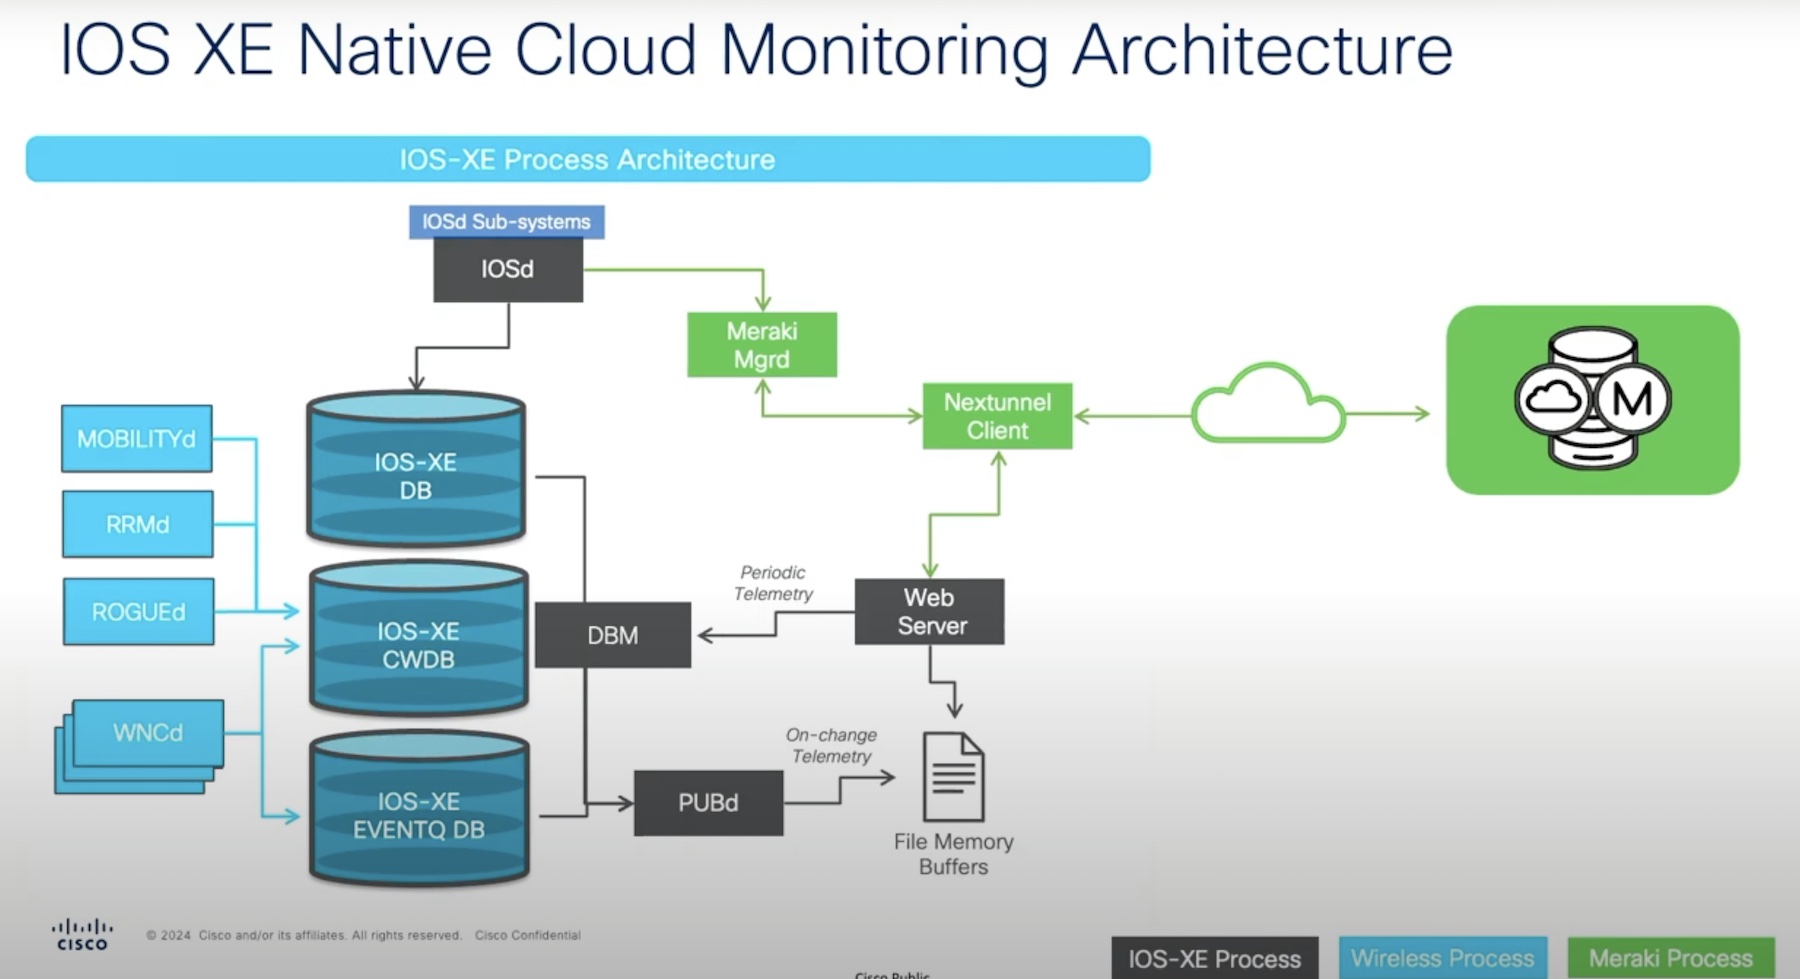
After several changes and tweaks to the architecture that caused the Meraki tunnel to extend to connect Catalyst devices and switches, the integration now allows for easy onboarding of Catalyst devices as well as live telemetry collection from devices.
The integrated view on the Meraki dashboard translates to unified visibility of state, configuration and troubleshooting features. For easy distinction, the Catalyst devices show up marked as “Monitor Only”, but apart from that, they function same as their Meraki cousins.
Cloud Monitoring comes available at no extra cost to the users. It is bundled with the Cisco DNA licenses, Essentials and Advantage. Irey notes, “The only difference is Advantage gets you client traffic analytics. So we get the inbar data from the controller, grab that data and display it in the dashboard that requires the Advantage.”
To find out how it works, check out the demonstration in the second half of this Cisco session from Tech Field Day Extra at Cisco Live EMEA 2024.