To make sure you’re reading the title correctly: Progress is the company that now owns WhatsUp Gold and Flowmon.
I just participated in two virtual sessions, one covering each of the two products. This article covers my impressions and what I learned – and what looked important! There’s a lot to both products, some of which was covered in the video recordings. I’ll refer you to those for some missing details.
Overall, Flowmon is now integrated into the WhatsUp Gold (“WUG”) dashboard and appears to be tying in SNMP data where relevant. More on this below.
The video sessions mostly concentrated on the capabilities of each product, with demos. It has been a while since I’d looked at either product, and they’ve both matured considerably. I had WUG positioned in my mind as a cost-effective, small-enterprise network management solution. It appears that WUG may have “grown up” to larger networks. I say “appears” since I’ve learned that network management (“NM”) looks great in demos, but you really need to get your hands on a copy and drive it hard to find out limitations, what works well, and what is hard or non-scalable.
WhatsUp with WhatsUp Gold
For NM products, the basic “table stakes” these days are ease of use and labor-saving features – built-in intelligence. We can no longer manage devices or enable features one device or interface at a time, life is too short. So any NM tool MUST have: fast automated network discovery, automated monitoring of key variables (and lots of them!), ease of enabling or tuning monitoring of various device types and various apps, automated alerting, etc.
WUG now has that. It does automated discovery, and leverages MAC tables to learn about things like servers; in other words, it is not totally network-centric. It collects and reports SNMP data, and not just for network devices. It also does WMI. Another feature that caught my eye is the ability to create templates, specifying what data to collect for each of various types of devices. WUG comes with libraries of templates, etc. for common needs and which you can apply or alter as needed.
Yet another note-worthy feature is the ability to set up template-based liveness and response time monitoring. An example – check whether all servers or VM’s respond, and better yet, check whether key applications are live and responding.
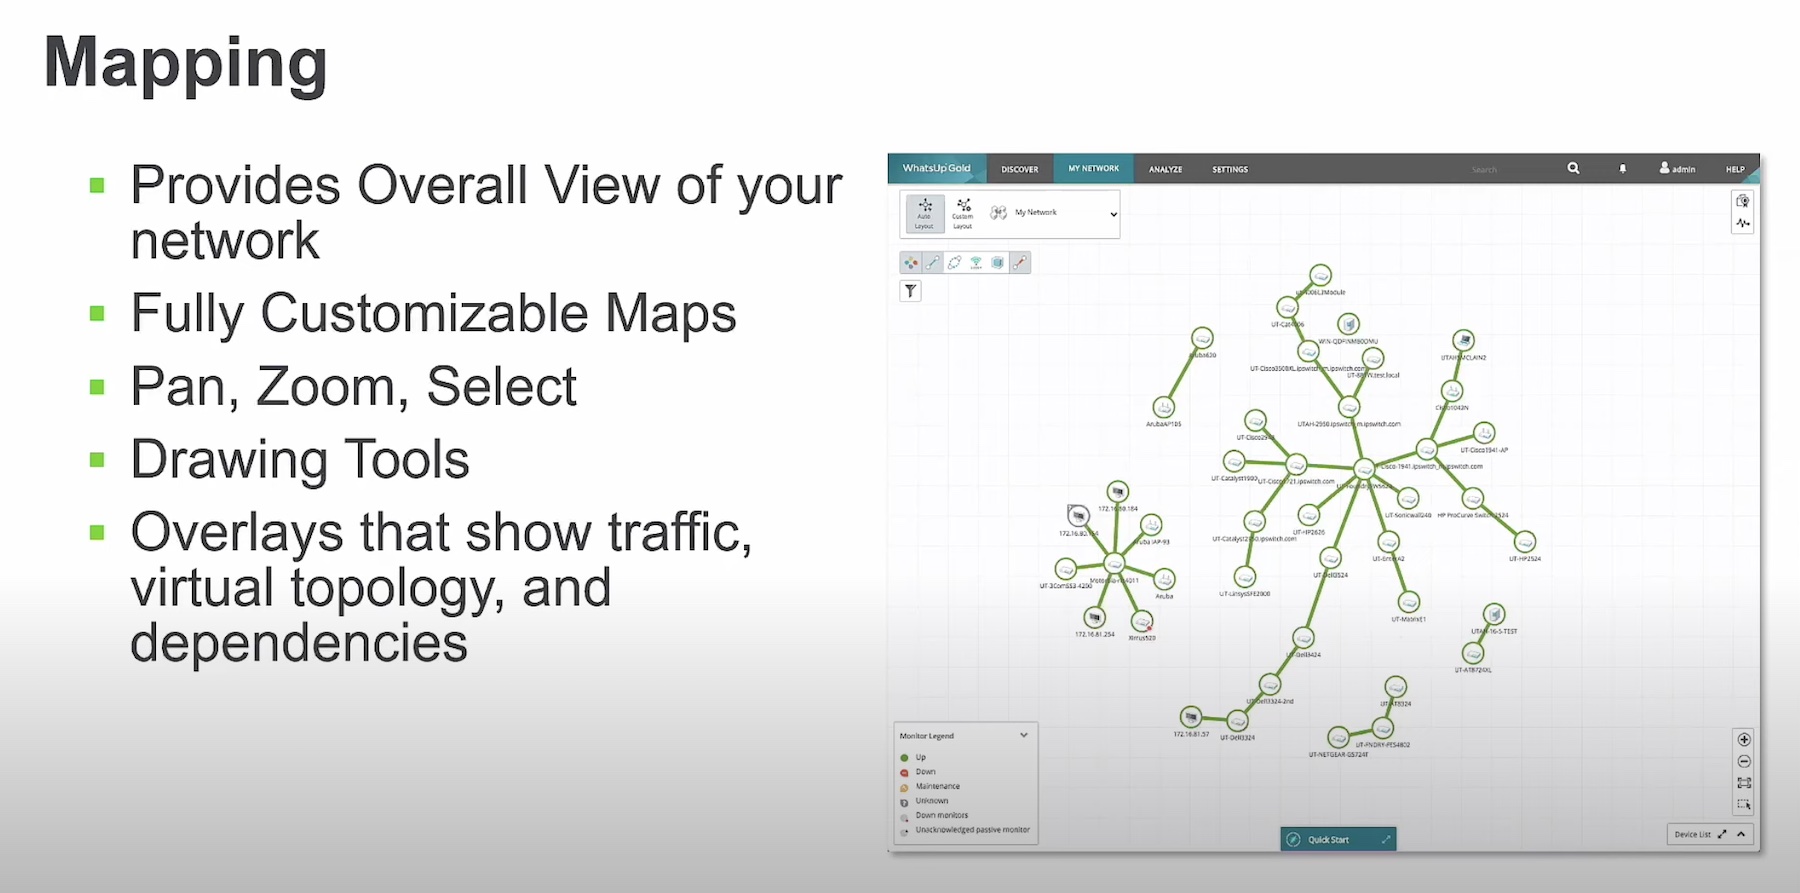
WUG now has automated network map layouts, which you can manipulate into a map hierarchy if you wish. The maps automatically update and can be colorized to show link utilization.
The following screen capture shows servers and other devices connected to a switch.
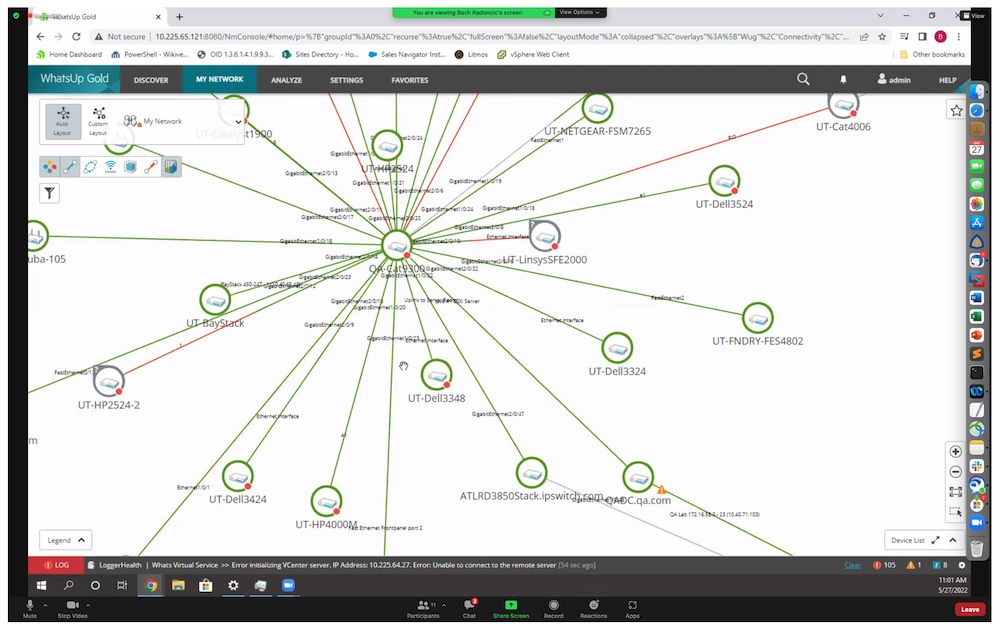
WUG also allows you to set up customized dashboards for site-specific needs (reports for management, etc.). There’s a lot more (e.g., wireless management with client awareness), but I’ll refer you to the video recording for that!
Getting with the Flow
WUG has some basic NetFlow collection and reporting capabilities through the new dashboard integration with Progress Flowmon.
My guess is that functionality probably has limited scalability – receiving NetFlow data consumes some CPU and a lot of disk, typically.
I’d expect that the product positioning is that Flowmon is the better choice for medium to large-scale NetFlow (and other forms of flow) data collection, bringing with it sophisticated reporting capabilities.
Flowmon is based on a “typical large scale” NetFlow collection architecture: you can have devices send NetFlow data or insert probes that monitor packets and send NetFlow, and you can have local or central collectors that receive the data and analyze it. Probes are available in hardware or virtual form. Cloud flow log data can now be ingested by Flowmon as well. Probes enhance IPFIX data with other enriched information such as L7 state, TLS, etc. Probe performance is claimed to be the most powerful NetFlow exporter on the planet.
Flowmon apparently can report using distributed collectors as a unified system to achieve greater scaling.
The dashboard has tabs for NetOps and SecOps reporting. The network reporting looked like “the usual” reporting, i.e. top sources, destinations, flows for a given source/destination/port, TCP or UDP flow stats, etc. with drill-downs. That included user-defined groupings with reporting based on the groupings. This sort of data is very useful to have when doing capacity planning and such things. Periodic reporting can allow you to compare and see what types of traffic are growing, or review for anomalies when you’re having a network performance problem.
“Packets don’t lie” – meaning that analyzing packet or flow data can tell you lot about what’s really happening in the network.
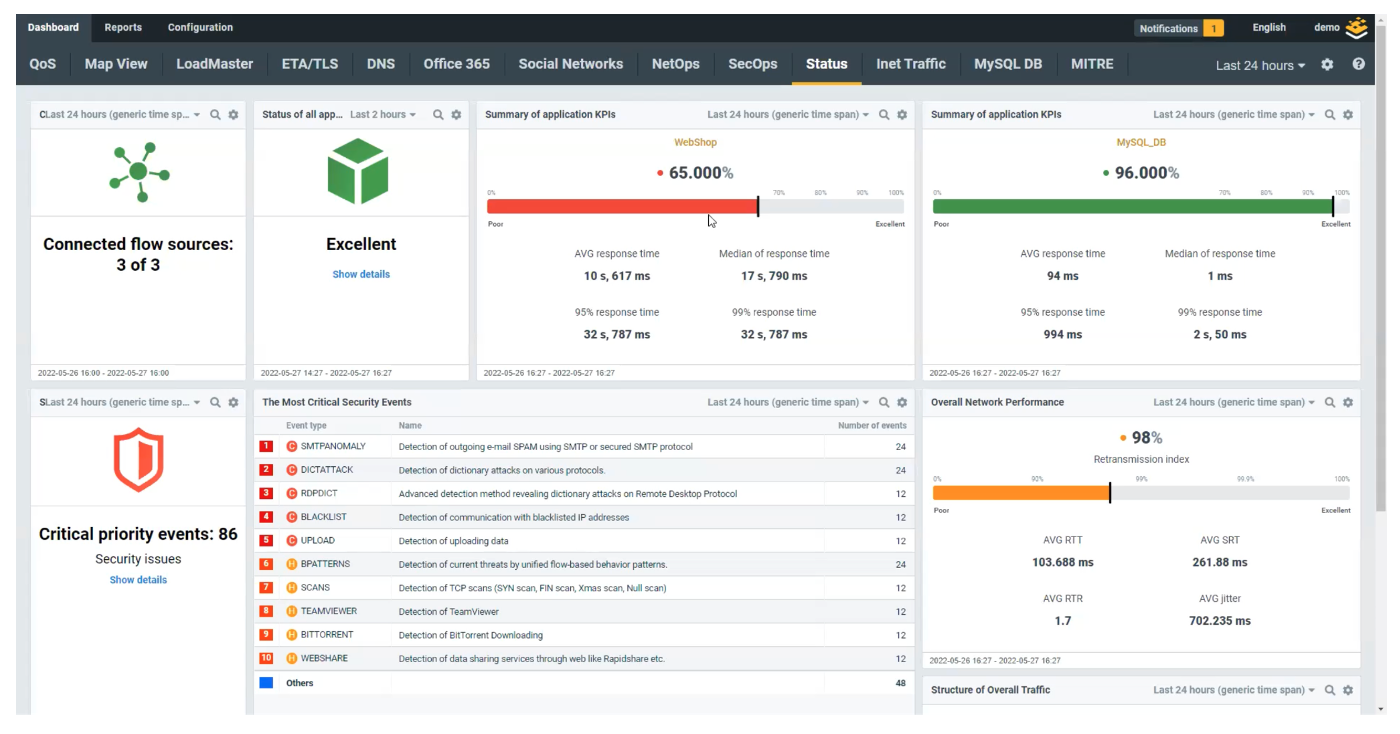
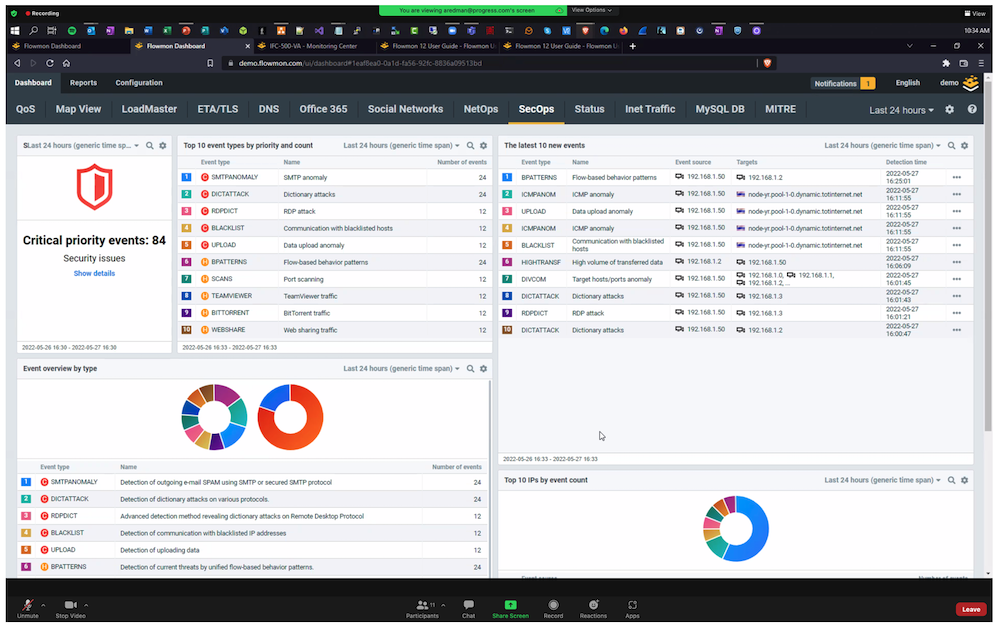
What particularly caught my attention was the security data reporting built into Flowmon.
Flowmon automatically detects various items of potential security interest, including potential malware and threats, based on changes in traffic flow behavior. For example, network scans, or a large increase in outbound data, or certain hosts transmitting a lot more data to external addresses. Or data exfiltration over another protocol such as ICMP or DNS.
The following screen capture shows some such alerts. Watch the video for more information!
Packet analysis can also detect things like slower than usual application response times or where user response times are degraded.
Based on experience, I really like the idea of getting “brown-out” data, telling me what portion of a network is having problems. That can really help troubleshoot – focus on the elements common to the problem locations but not the non-problem locations.
Flowmon recognizes that flow data can usefully be augmented with network data, and vice versa. I did not note any details around that.
Flowmon can also leverage user ID data to tie users to traffic flows.
Staying Alert
Alerting can be sent to various common logging/alerting platforms. It can now be sent to MS Teams, Slack and Splunk, as well as selected Security Event Management systems.
WUG uses a dependency system to suppress redundant alerts. Dependencies are generated by discovery but can also be added manually, including from maps. Why do this? Well, for example, if a site router or router pair is down, you really don’t need to be caught in an “alert storm” coming from the various devices at that site.
Watch the video for more info about this!
Conclusions
WhatsUp Gold has been considerably enhanced since the last time I looked at it. It apparently does quite a bit “out of the box” and provides some powerful template and dependency tools to augment that.
Flowmon has been around for a while and appears to be capable of providing actionable flow-based intelligence about traffic changes and possible symptoms of malicious activity in your network.
WUG has a free trial copy download. So does Flowmon. The only cost is providing your contact information to the vendor, as one would expect.
Links
Main WUG page: https://www.progress.com/network-monitoring, or https://www.whatsupgold.com Main Flowmon page: https://www.flowmon.com/en
Check out more about Andrew Redman and watch the presentation on Tech Field Day Site or on the Gestalt IT website.