In my last post, I wrote about how impressed I was with Riverbed’s SD-WAN offerings. I was able to get a branch device running on my laptop with relative ease. It proved that switching from an expensive private line connection, like MPLS, to SD-WAN is relatively easy with the hardest part being the planning. However, as a recovering network engineer, my biggest concern with changing to SD-WAN is the applications and how developers and users will blame the network (in this case, the new Internet-based WAN) when a problem arises.

For many years, vendors have been adding the ability to monitor metrics to their products. For instance, a SQL DBA can look at metrics about SQL database performance while a Windows server admin can look at event logs and open Task Manager to see hardware metrics like CPU and memory usage. The network team can look at the hardware of their switches to see how data is flowing. What would be nice is if there was a way to combine those (and other metrics) so we can see how applications are performing both within the systems and across the network at the same time.
Riverbed Portal and SteelHead
Riverbed has a way to do this with a product called Portal. When you switch to using SteelHead appliances for connectivity, you can get more visibility into how the network and the applications are working together. Plus, you can get information from other non-Riverbed products, so you can use Portal even if you do not switch to Riverbed SD-WAN. Fortunately for me, Riverbed allowed me to use their demo environment so I could play a little with the product. What I can tell you from my time is that it does answer the problem I mentioned before: when an application performance issue arises, how can IT pinpoint the actual problem? More information from Riverbed can be found at https://www.riverbed.com/blogs/steelcentral-portal-central-manager-enhances-support-for-appresponse.html.
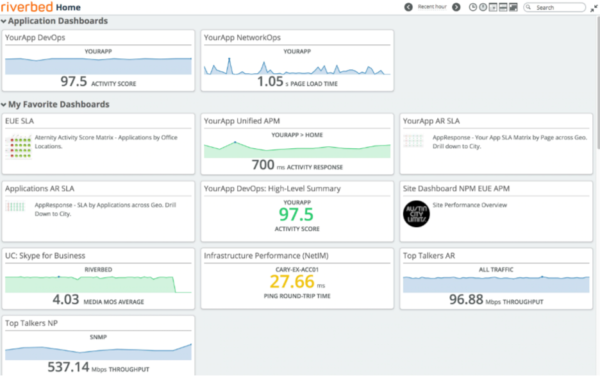
Main Portal Dashboard
There is an initial installation that must be done as there is no way for Portal to know everything about your network right after installation. Admins will have to install tools to allow the product to read the data. This includes Riverbed physical, virtual, or Cloud appliance like AppResponse, NetProfiler, and NetIM, and also Aternity EUEM and APM tools. Fortunately, Riverbed products (like the Steelhead appliances) already have these tools installed. It is where you are not running Riverbed devices that you will want to install the tools, such as gathering information on that SQL-based application your developers claim never has any performance issues.
Once Portal is set up with data ingestion from devices and applications, you can set up dashboards so that everyone can see correlated data across different domains. Obviously, it can get a lot of network information from SteelHead appliances pretty quickly, but you can add other application visibility like Windows servers and cloud services like Office365 and Azure/AWS. With relative ease, I was able to find the top talkers on the demo environment and see a map of an application. By using historical data, I was able to find what normal network traffic should look like. Knowing what is considered normal traffic makes it easier to set up alerts when performance issues arise.
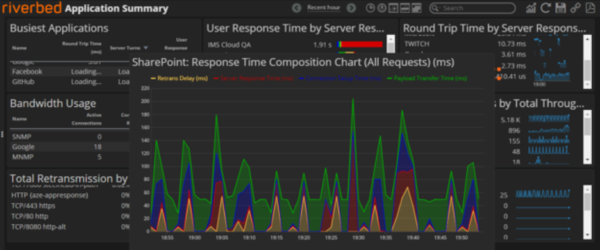
SharePoint Composition Chart: The Payload Transfer is the Problem
The primary feature of Portal seems to be the dashboards. I could create different dashboards for different views. For instance, a developer would probably want to see basic information about the network, such as seeing if it is running normal, with more information about server and application performance. I could create unique dashboards for different people rather than having generic views for everyone. There is a point in having a dashboard with information that tends to get ignored.
One of the things I thought was cool was the built-in search feature. I found it really easy to search across the data because I could search by different items like IP address, device name, and even vendor name. For instance, I was able to search using “Palo Alto” to find the PANW devices being monitored in the Riverbed demo environment. Even without a dashboard on the PANW firewalls, I was able to use the search feature to see details like availability over time, CPU utilization of the devices, and interface utilization in a simple graph. Plus, I could change the timeframe with ease.

PANW Dashboard created using Search
Because of the agent deployments, it appears that Portal needs a little work to get to a useful point for all IT teams. But once it is fully operational, each team can have its own dashboard that shows performance metrics, which is a great place to start your day. Not only can it help the teams to see problems as they arise, but it can also allow them to see a little into the other teams’ views so they can better discuss when a performance issue arises. Maybe it will even help to stop first blaming the network every single time.